Commercial Land
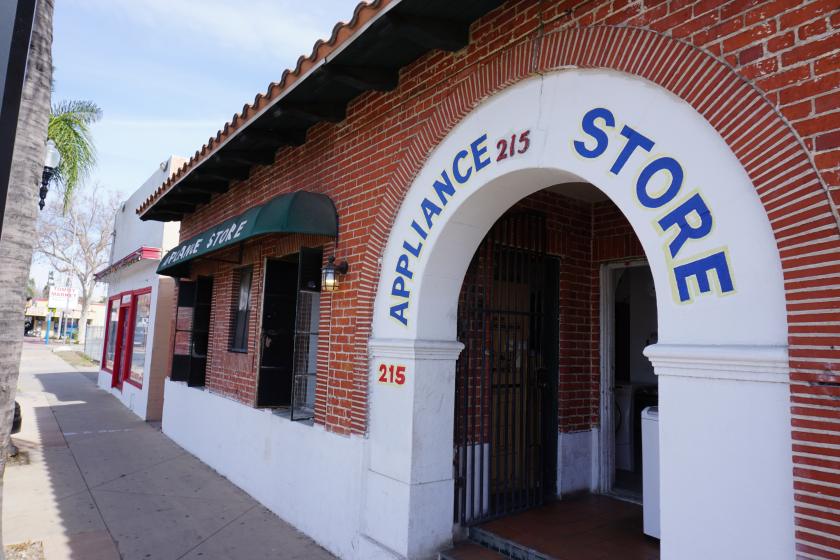
209-221 South Main Street Santa Ana, CA 92701
209-221 South Main Street Santa Ana, CA 92701
Details & Description
Property Highlights
- • 3 parcels along South Main Street with Cash-flow
- • 28,807 Square feet of Land
- • Prime Redevelopment Opportunity
- • Opportunity Zone
- • Blocks from Down Town Santa Ana Historic District
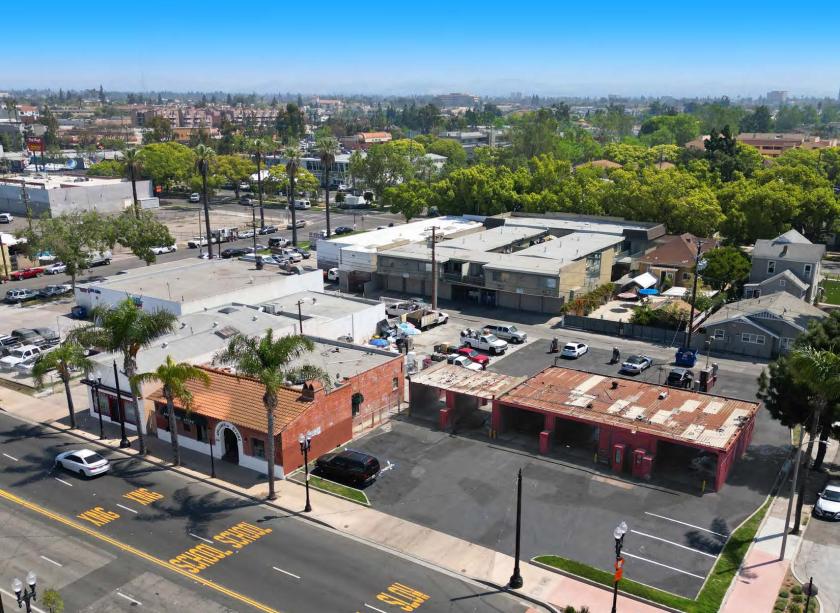
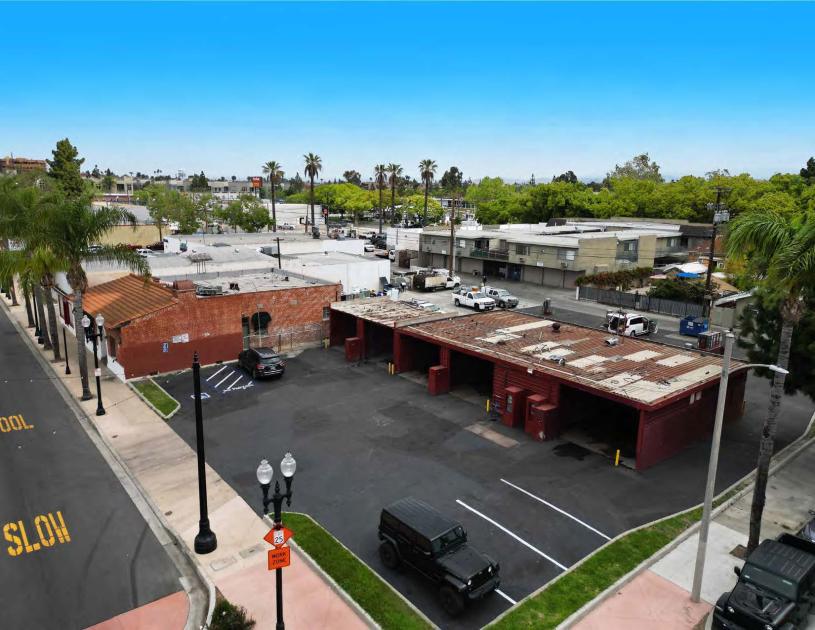
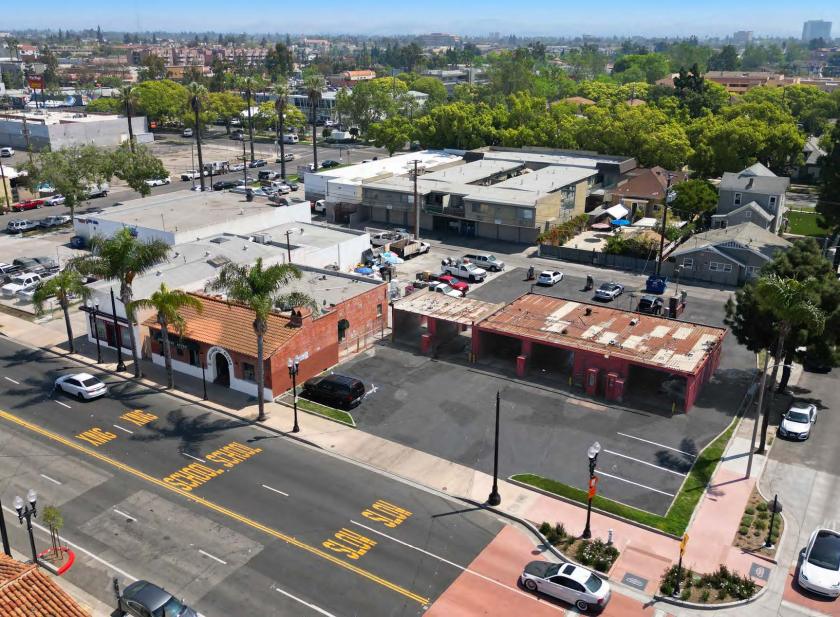
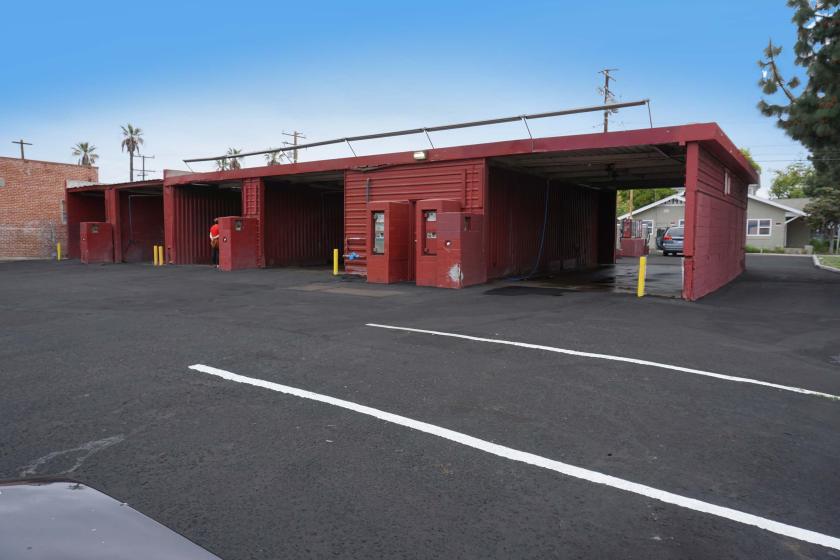
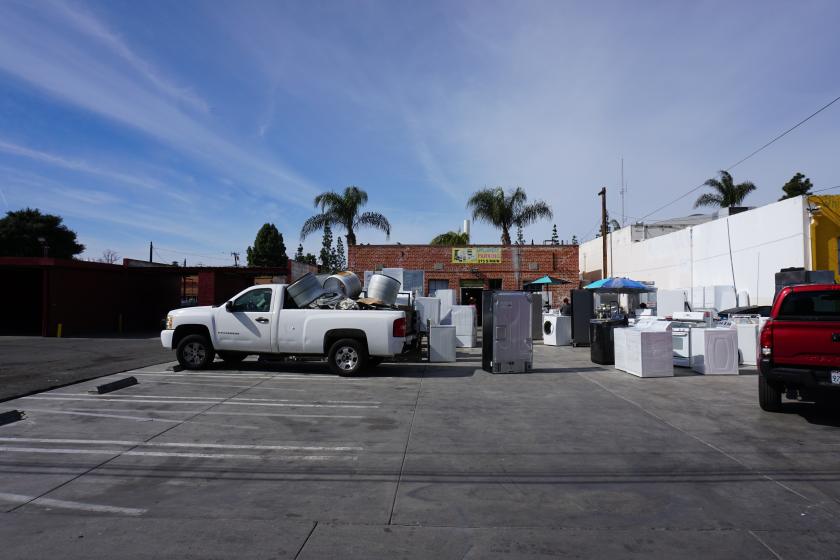
Additional Photos
Listing Agents

David Cendejas
SVN Vanguard
O: 714-446-0600
M: 909-815-1081
david.cendejas@svn.com
SVN Vanguard
O: 714-446-0600
M: 909-815-1081
david.cendejas@svn.com
While we strive to provide the most accurate information, all listing information, and demographic data, is provided by third-parties. As such, MyEListing will not be responsible for the accuracy of the information. It is strongly recommended that you verify all information with the listing agent, and any relevant agencies, prior to making any decisions.