Office Space
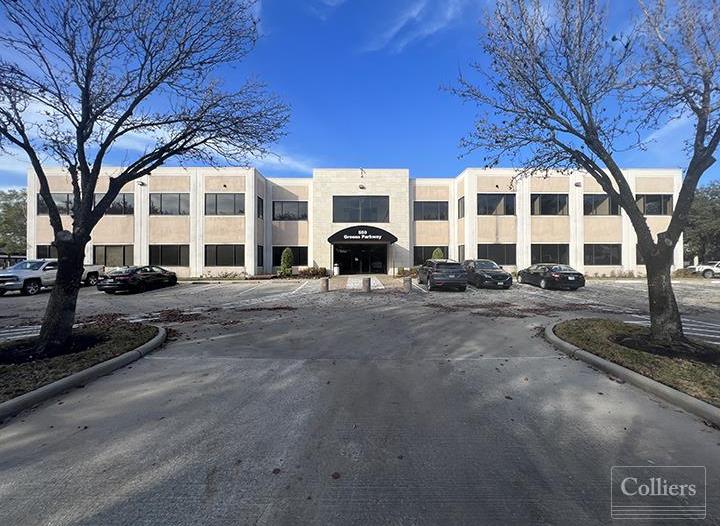
550 Greens Parkway Houston, TX 77067
550 Greens Parkway Houston, TX 77067
Details & Description
Property Highlights
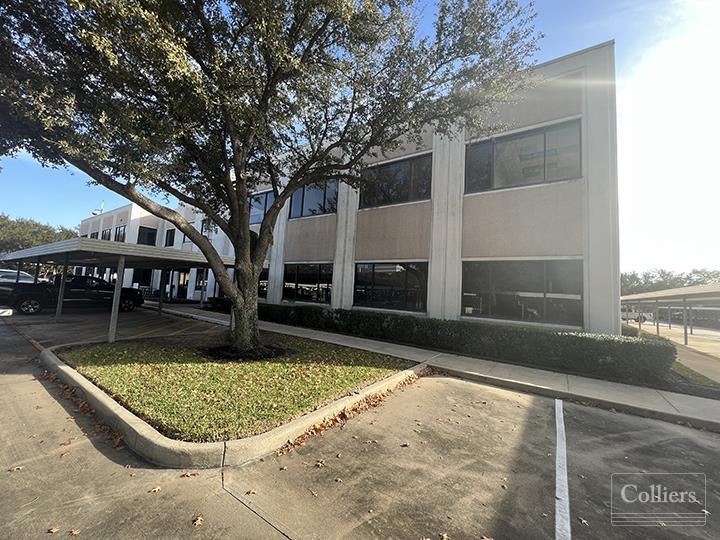
- • Two story atrium lobby
- • Building exterior features mature oak trees
- • Located near George Bush Intercontinental Airport
- • Lush landscaping
- • Controlled access system
- • On-site security
Listing Agents

Douglas Pack
O: 713-835-0041
M: 713-818-5782
doug.pack@colliers.com
O: 713-835-0041
M: 713-818-5782
doug.pack@colliers.com
While we strive to provide the most accurate information, all listing information, and demographic data, is provided by third-parties. As such, MyEListing will not be responsible for the accuracy of the information. It is strongly recommended that you verify all information with the listing agent, and any relevant agencies, prior to making any decisions.