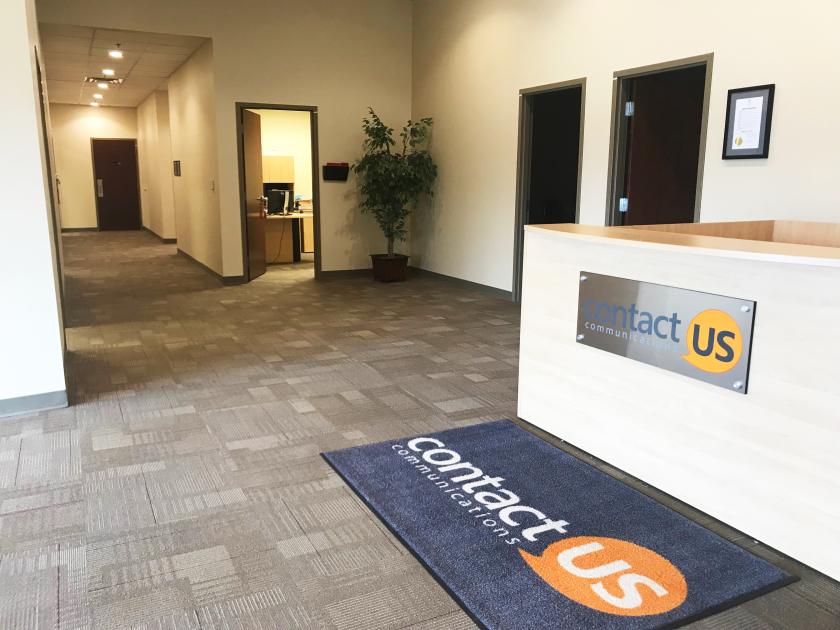
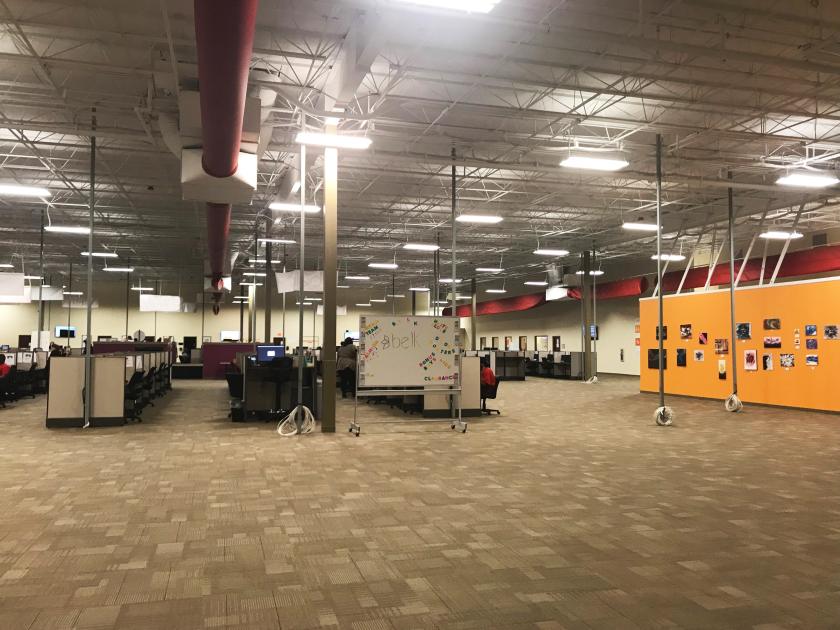
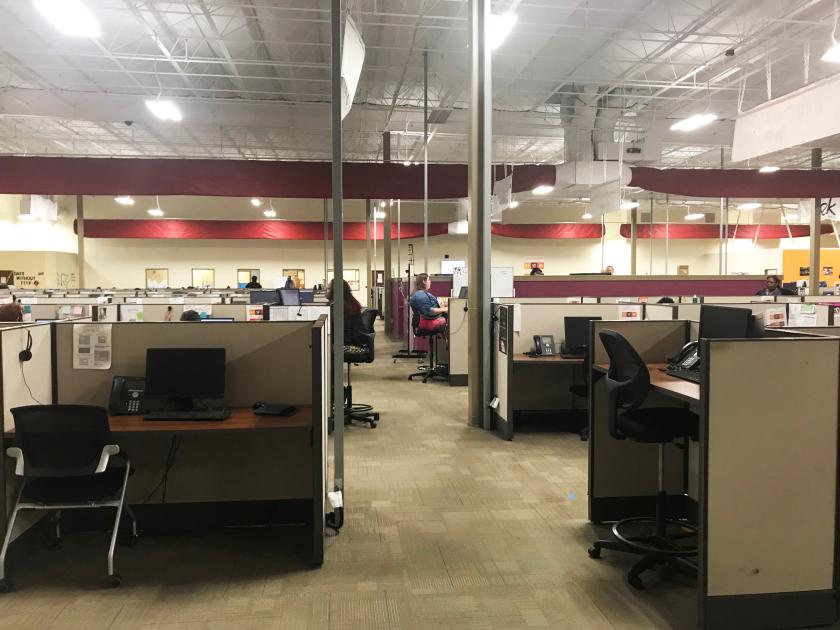
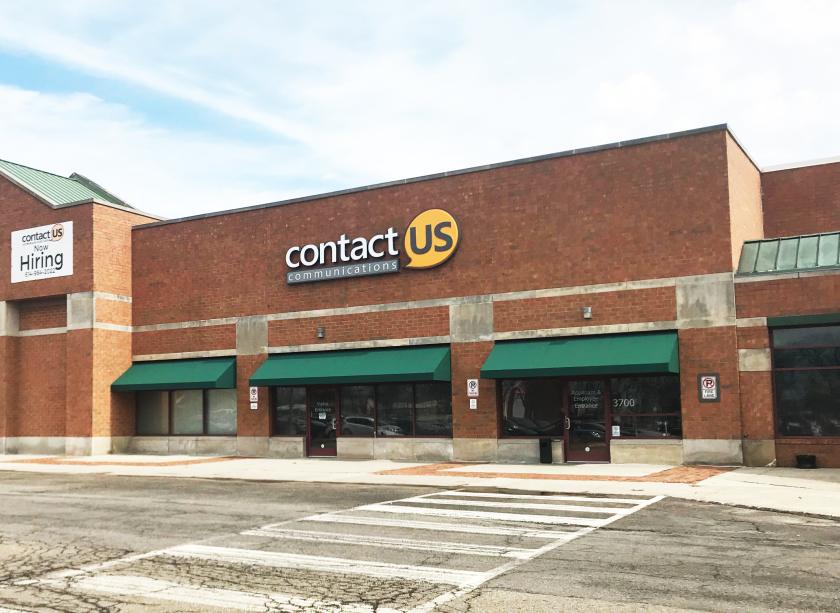
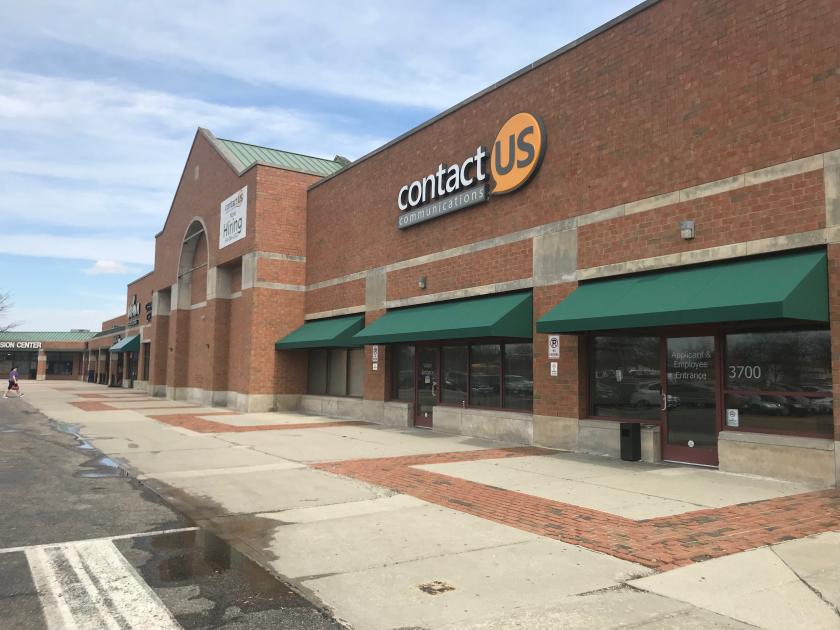
Retail Space
3700 Fishinger Boulevard Hilliard, OH 43026
3700 Fishinger Boulevard Hilliard, OH 43026
Details & Description
Property Highlights
• Current tenant leases 100% of the condo on a lease until 2024.
• Includes a portion of the surface lot parking
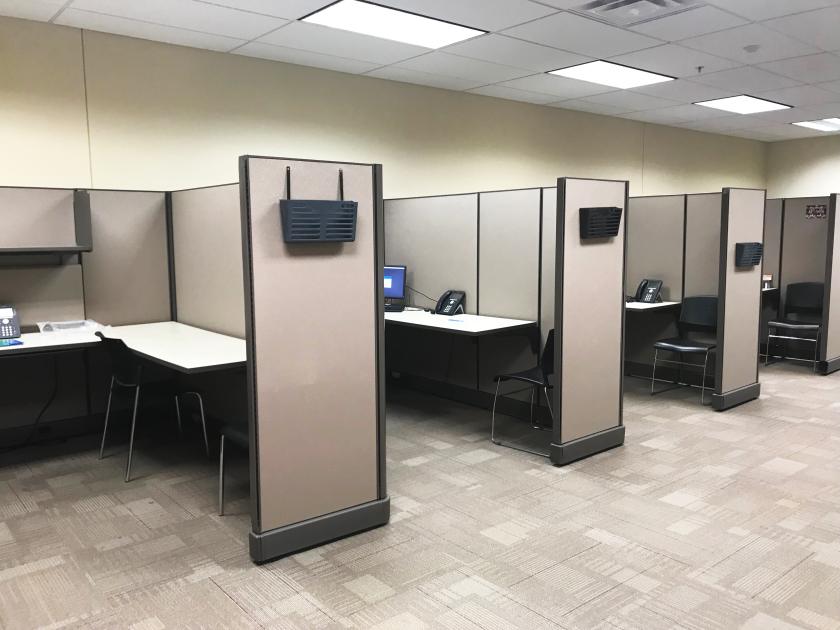
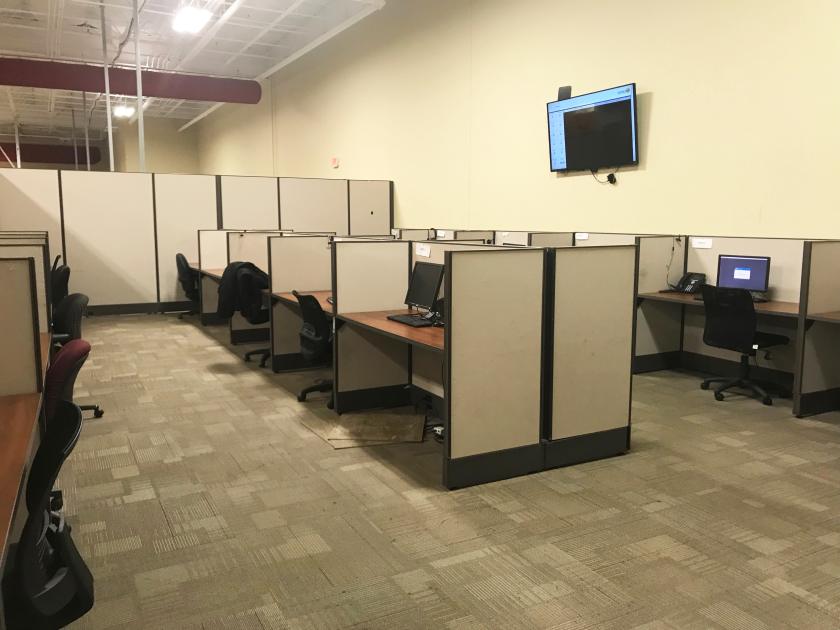
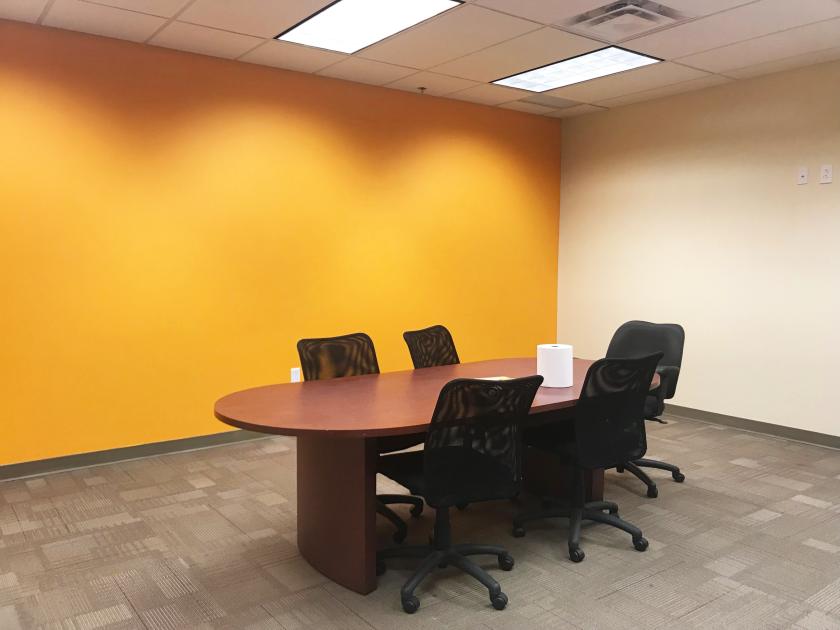
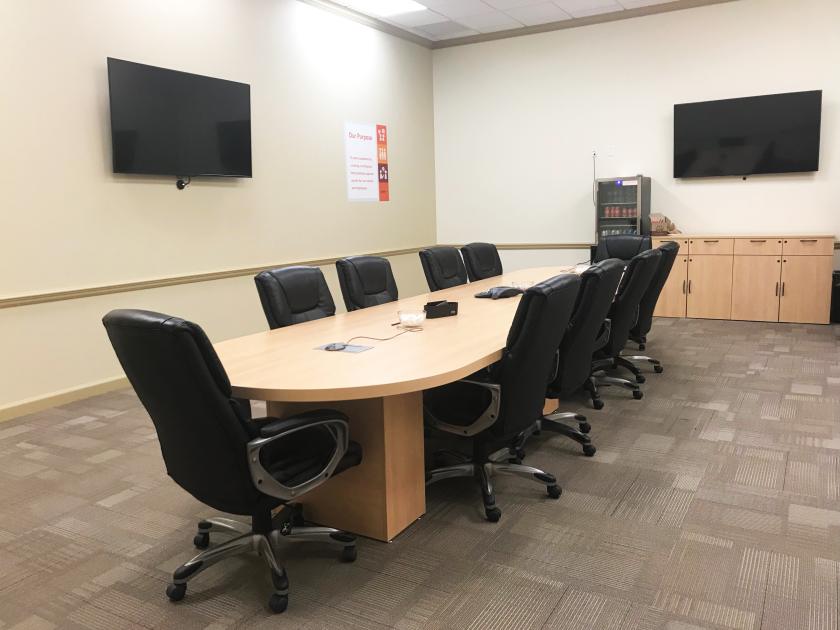
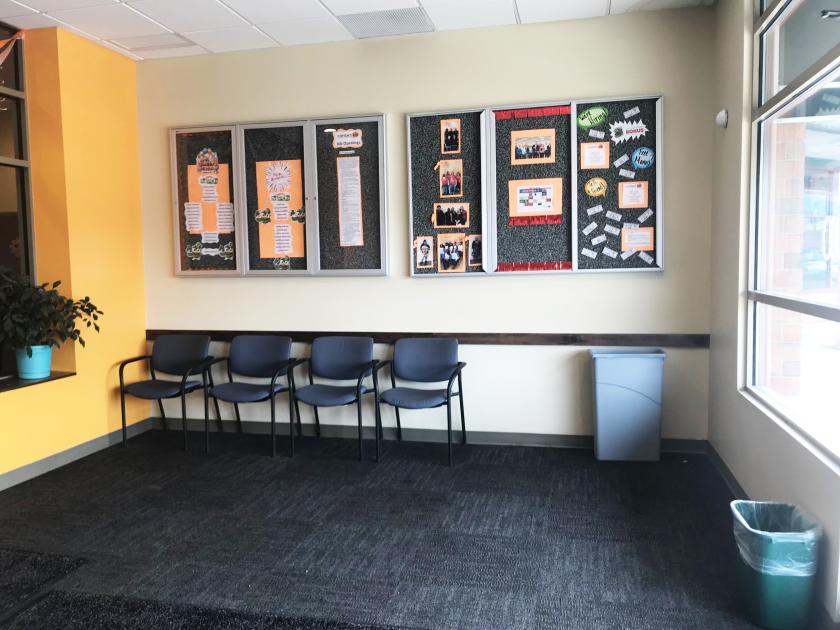
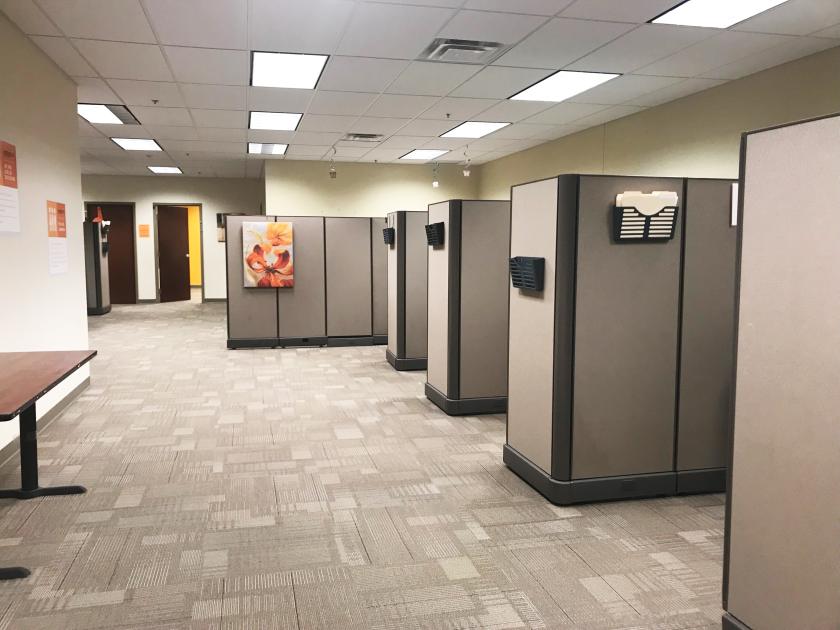
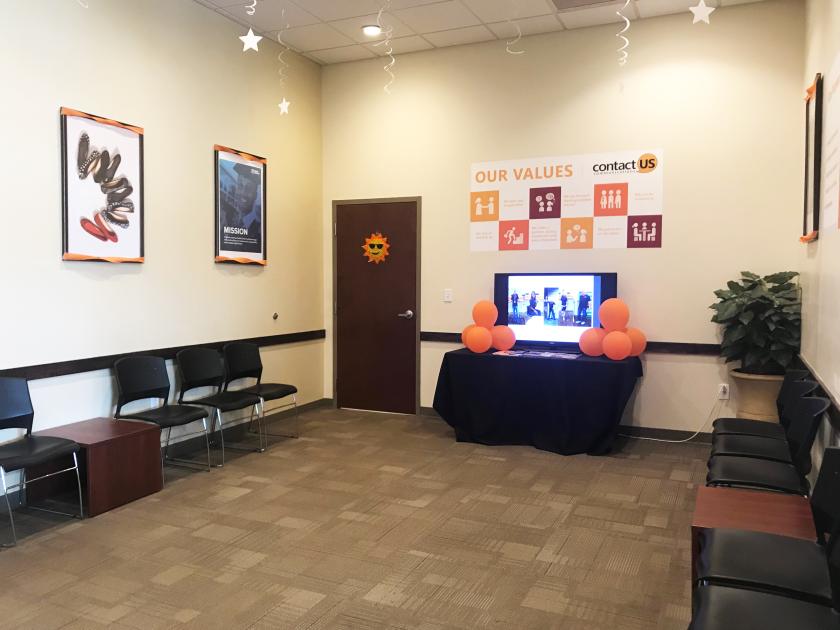
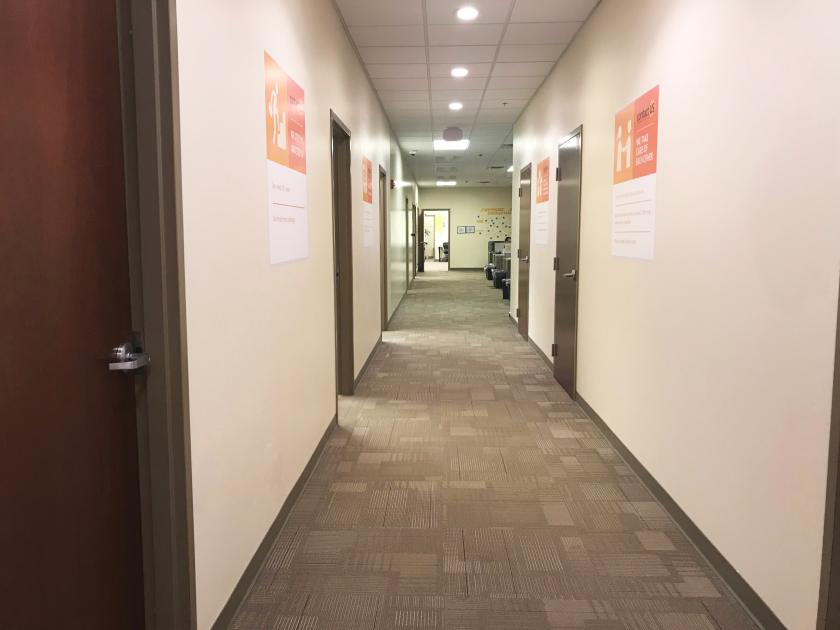
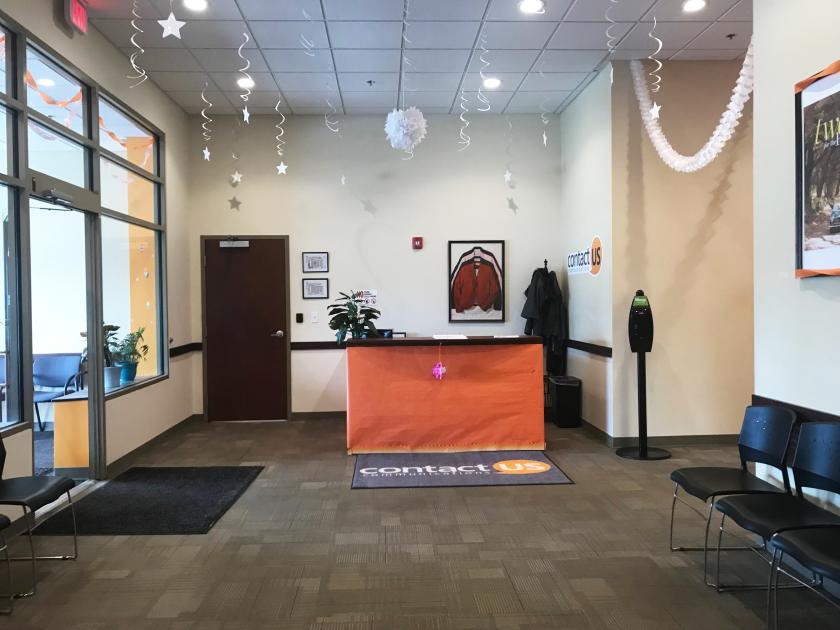
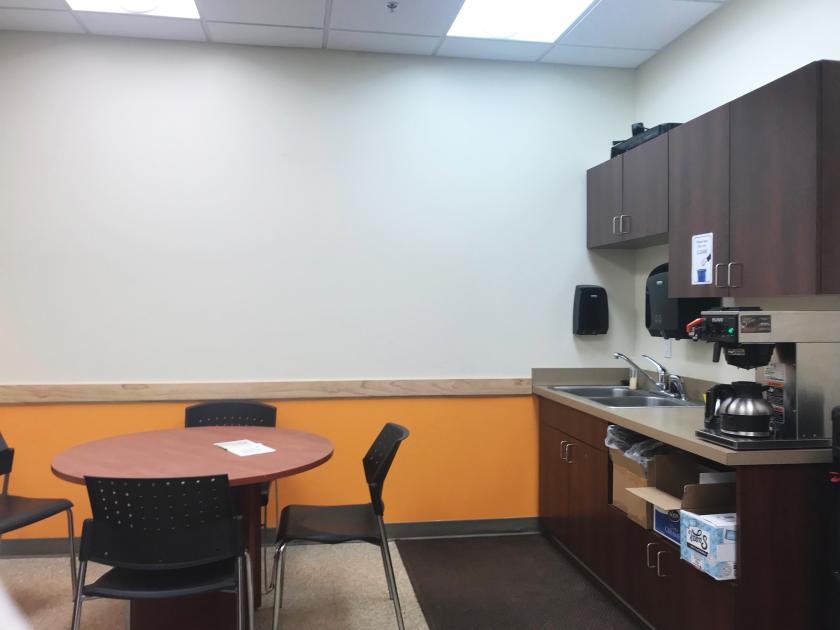
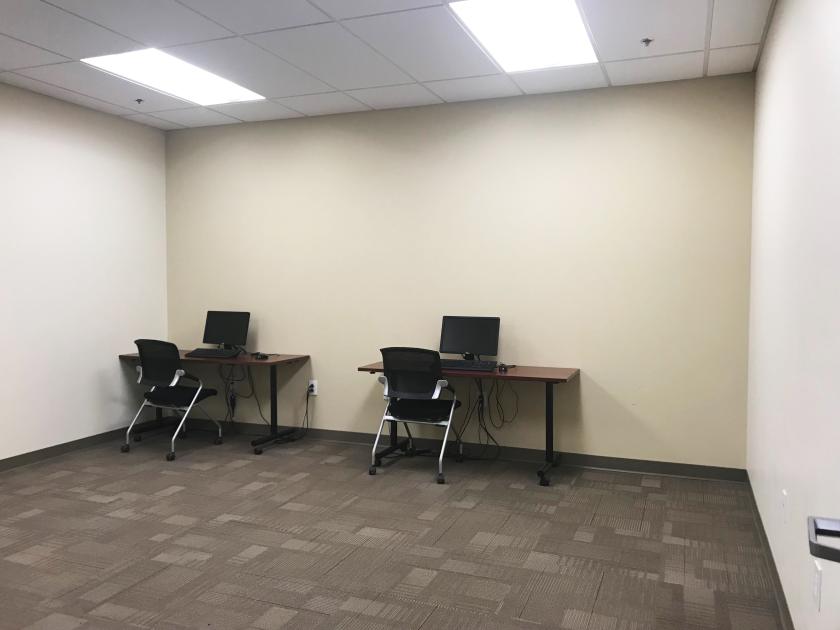
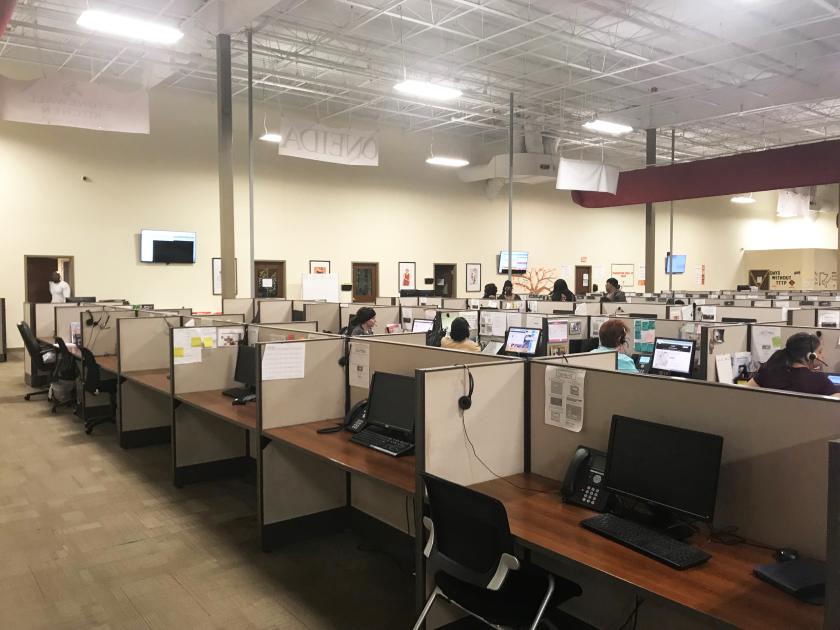
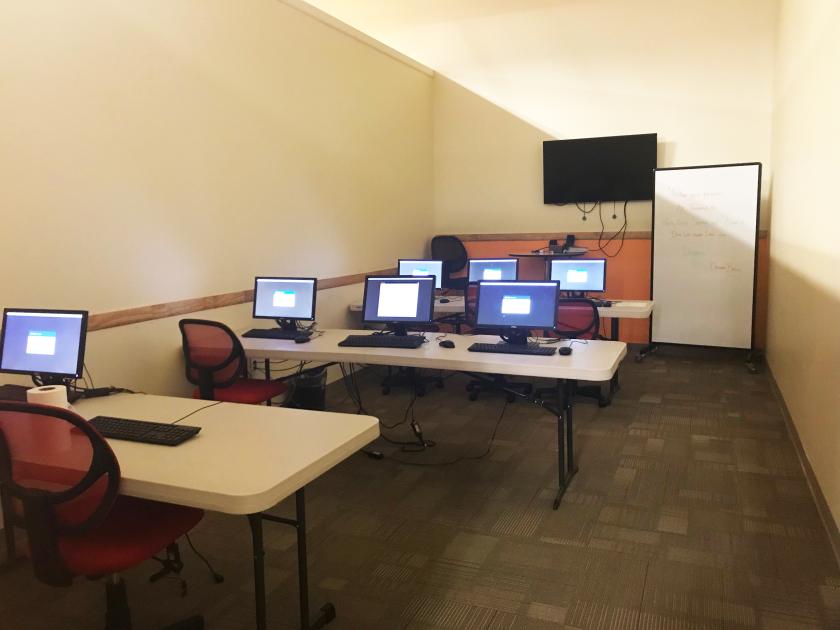
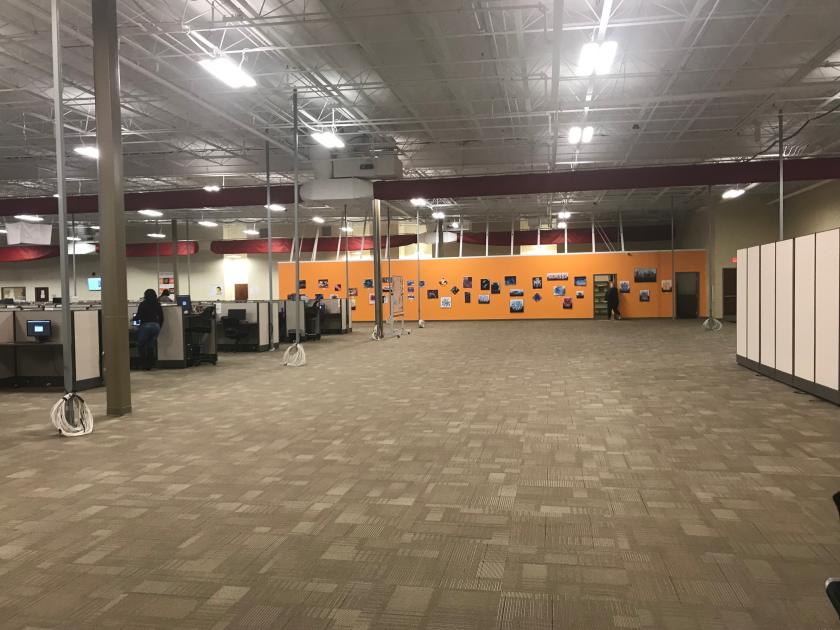
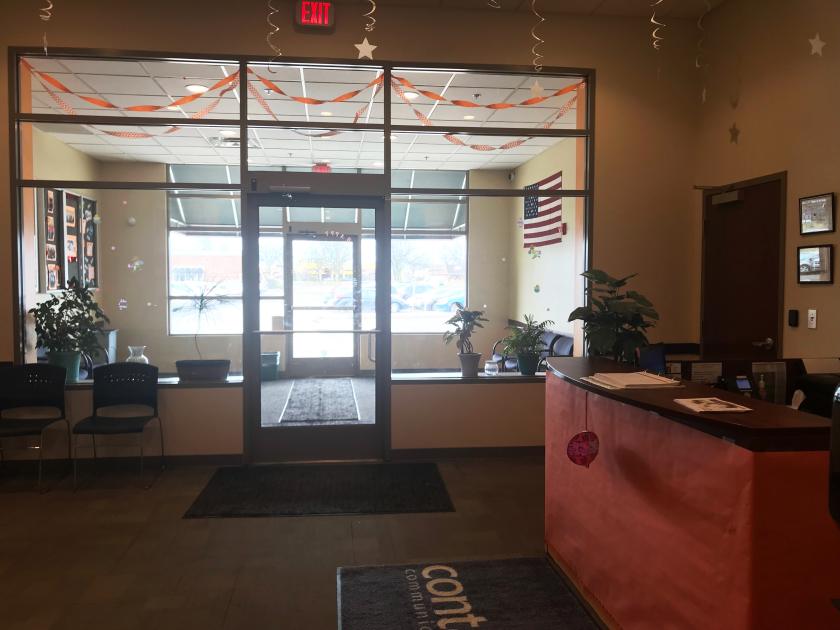
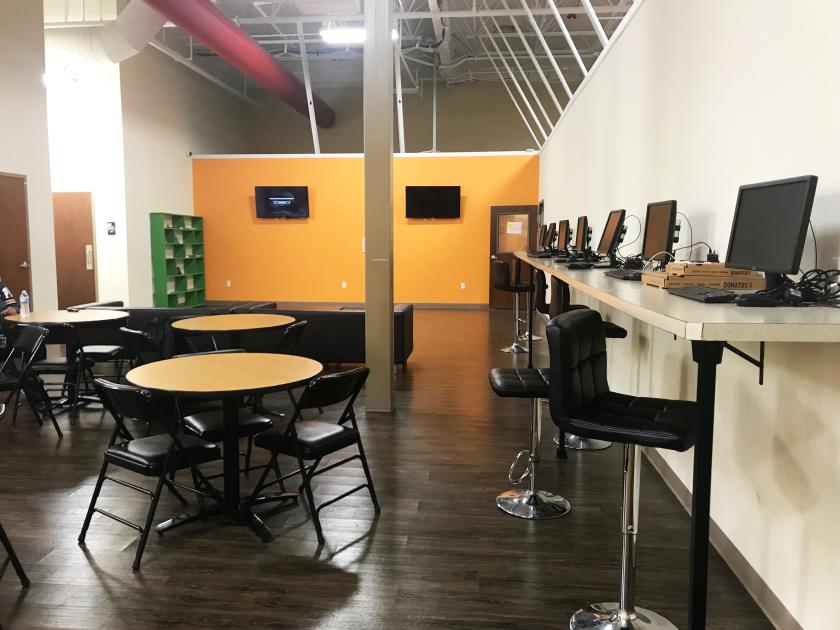
Additional Photos
Listing Agents

Skip Weiler
O: 614-221-4286
skip@rweiler.com
O: 614-221-4286
skip@rweiler.com
While we strive to provide the most accurate information, all listing information, and demographic data, is provided by third-parties. As such, MyEListing will not be responsible for the accuracy of the information. It is strongly recommended that you verify all information with the listing agent, and any relevant agencies, prior to making any decisions.