Office Space
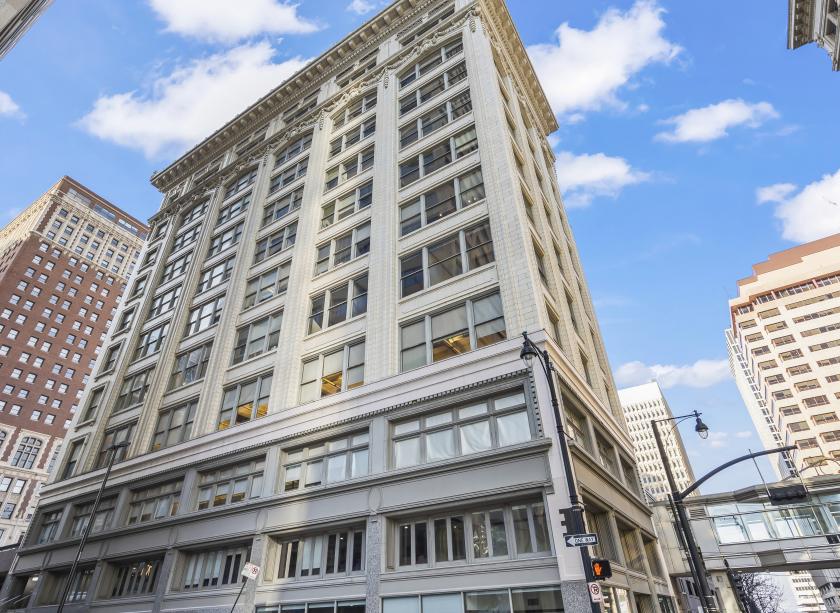
1044 Main Street Kansas City, MO 64105
1044 Main Street Kansas City, MO 64105
Details & Description
Property Highlights
- • Close to Jackson County Courthouse and City Hall
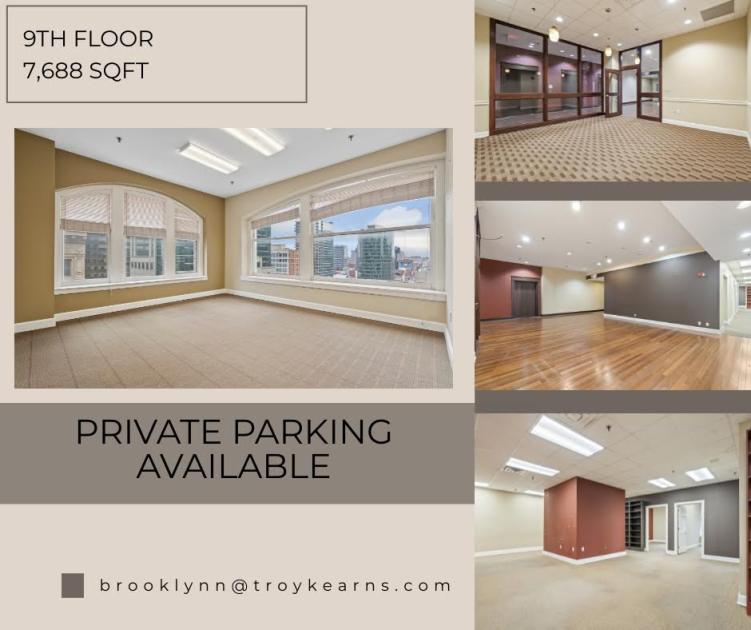
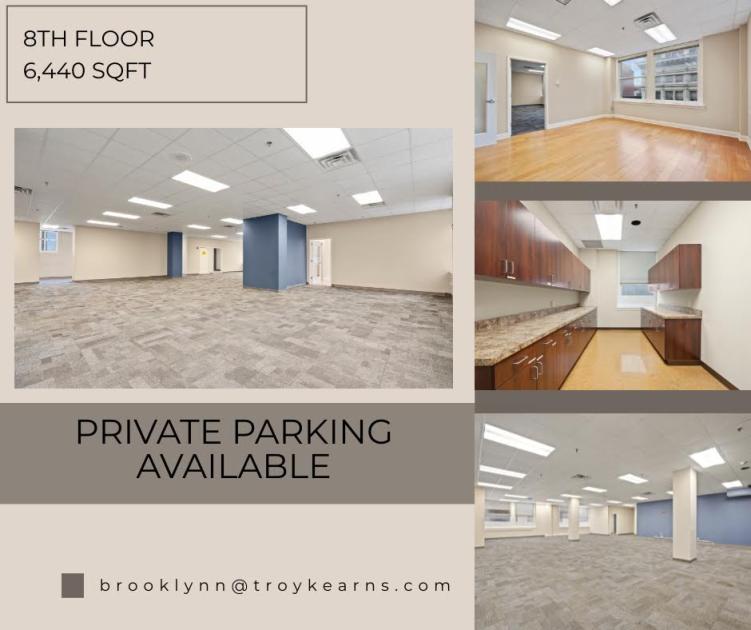
- • Covered and Surface Parking
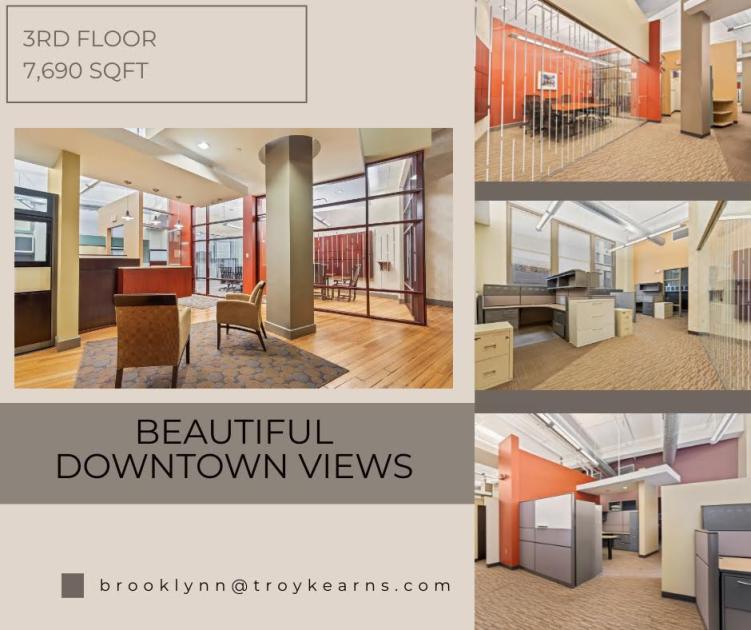
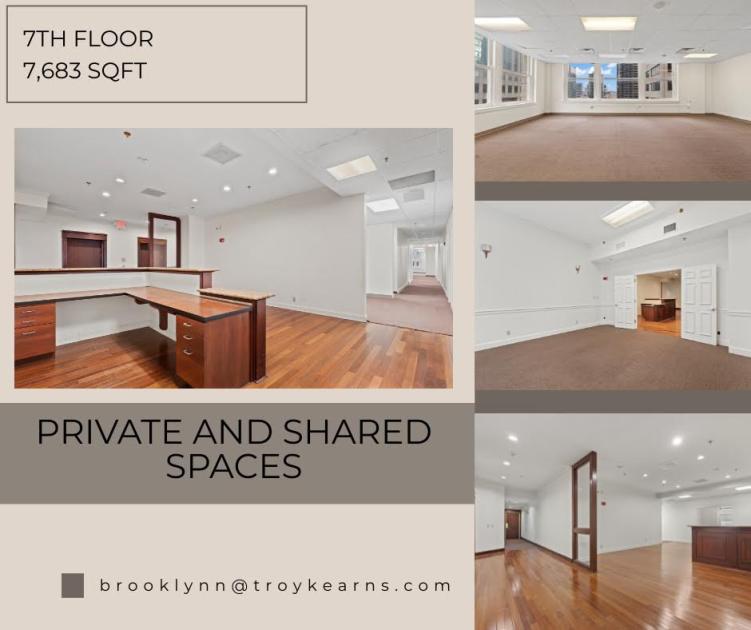
- • Shared Offices and Full Floors
- • Air Conditioning
- • 24 Hour Access
- • Commuter Rail
Additional Photos

Listing Agents

Brooklynn Hendrix
brooklynn@troykearns.com
brooklynn@troykearns.com
While we strive to provide the most accurate information, all listing information, and demographic data, is provided by third-parties. As such, MyEListing will not be responsible for the accuracy of the information. It is strongly recommended that you verify all information with the listing agent, and any relevant agencies, prior to making any decisions.