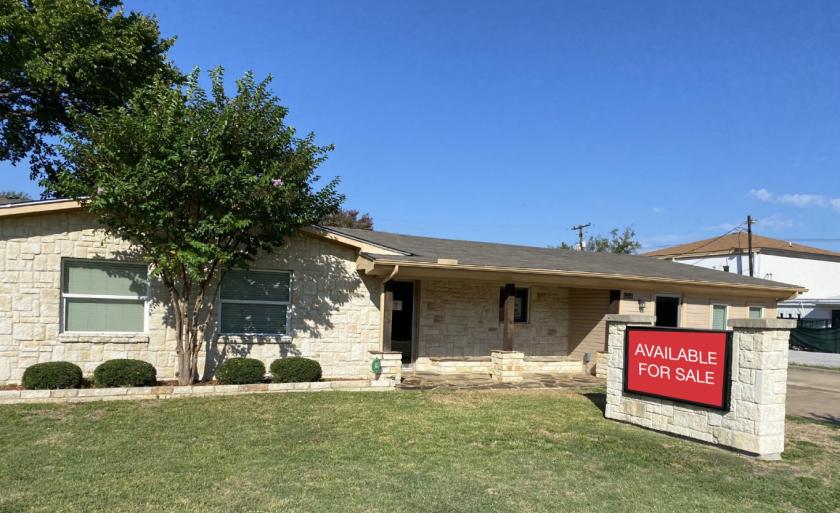
Office Space
3921 Oxley Drive Richland Hills, TX 76180
3921 Oxley Drive Richland Hills, TX 76180

Details & Description
Property Highlights
- • Quick Access to Loop 820 & Hwy 183
- • Gated Parking
- • Monument Signage
- • Located Directly Off Glenview Drive
- • Perfect Owner/User Building
- • Private Parking Behind Building
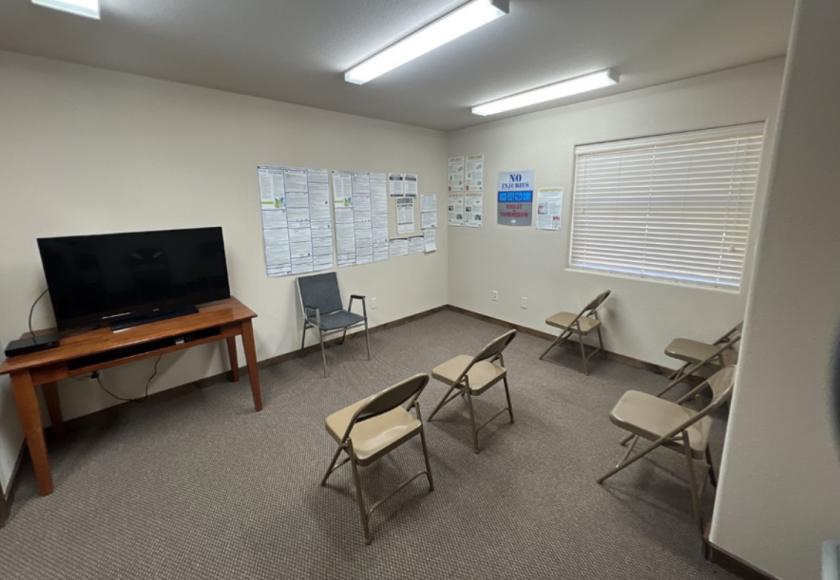
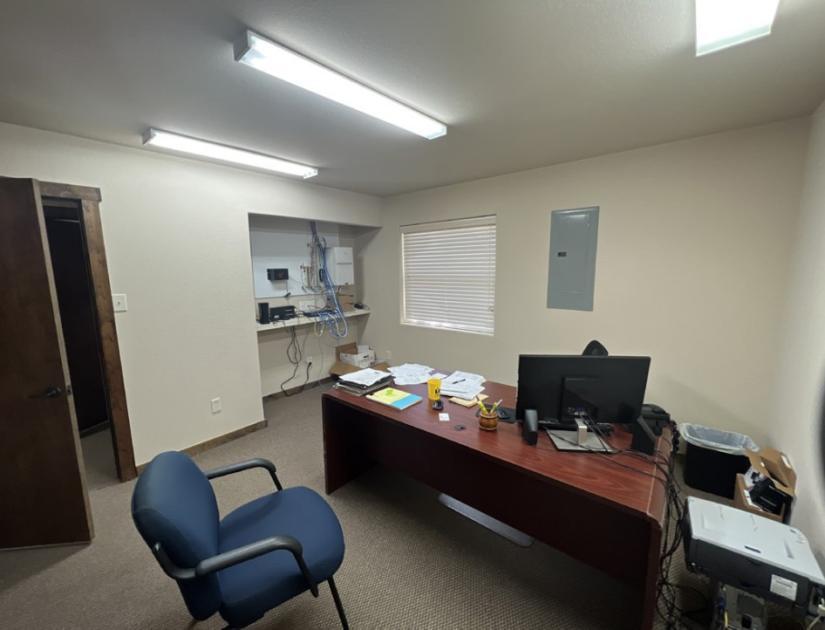
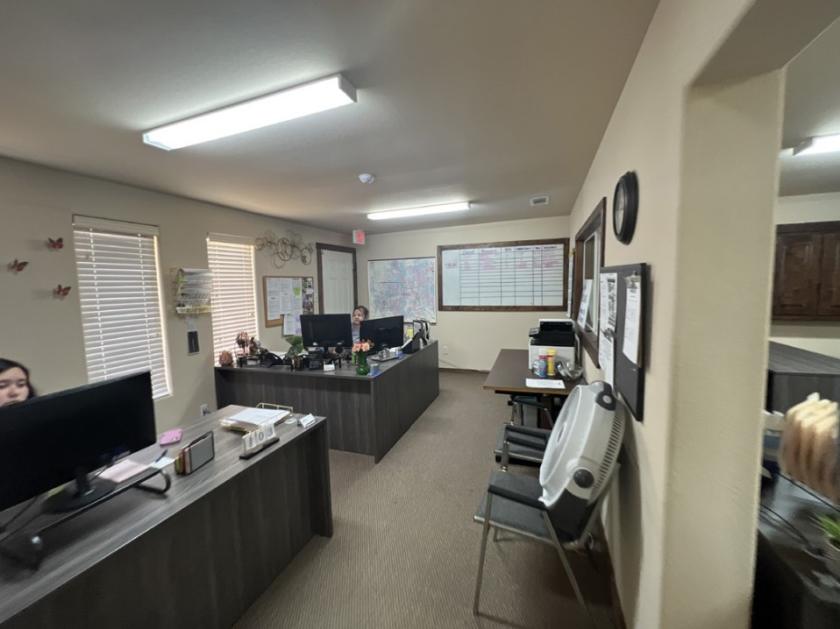
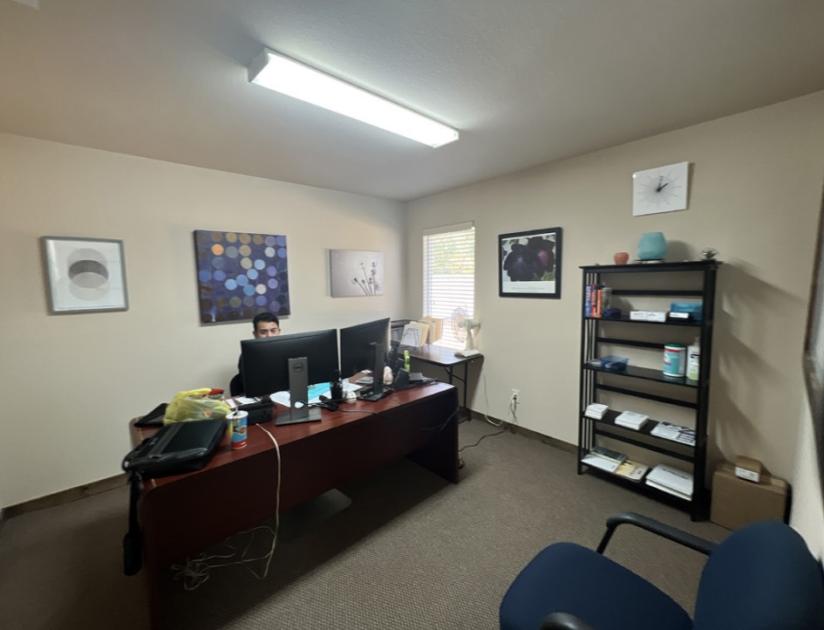
Additional Photos

Listing Agents

Logan May
O: 817-872-3909
M: 325-642-4312
lmay@nairl.com
O: 817-872-3909
M: 325-642-4312
lmay@nairl.com

Hunter Hayes
O: 817-872-3911
M: 817-487-7200
hhayes@nairl.com
O: 817-872-3911
M: 817-487-7200
hhayes@nairl.com
While we strive to provide the most accurate information, all listing information, and demographic data, is provided by third-parties. As such, MyEListing will not be responsible for the accuracy of the information. It is strongly recommended that you verify all information with the listing agent, and any relevant agencies, prior to making any decisions.