- Quietly Marketed - Do Not Disturb Tenant
- 10,000 SF Retail Available
- Site Size: 0.48 Acres
- Zoning: C-3 (Regional Commercial)
- Pylon Signage Included
- Adjacent to Brickwood Plaza
- Direct Access from 3300 South
- Busy Area with High Traffic Counts
- Easy Access to I-15, I-80 & Highland Drive
Price Reduction: $1,960,000.00
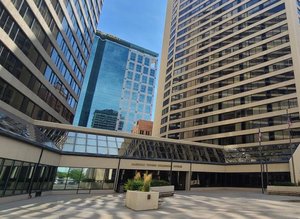
1221 East 3300 South, Millcreek, Utah 84106
For more information on this property, please contact Derek Klopfer and Colter Smith at 801.617.1700 or by email at derek.klopfer@crcnationwide.com, colter.smith@crcnationwide.com. Derek and Colter are licensed real estate agents in the state of Utah and are affiliated with cRc Nationwide Real Estate Brokerage.
No part of this information may be copied, reproduced, repurposed, or screen-captured for any commercial purpose without prior written authorization from MyEListing.
While we strive to provide the most accurate information, all listing information, and demographic data, is provided by third-parties. As such, MyEListing will not be responsible for the accuracy of the information. It is strongly recommended that you verify all information with the listing agent, and any relevant agencies, prior to making any decisions.
What is the asking price for 1221 East 3300 South in Millcreek?
The asking price for 1221 East 3300 South is $1,960,000
What is the building size of this Retail property in Millcreek, UT?
The size of the building/unit at 1221 East 3300 South in Millcreek is 10,000 square feet
How much land does the Millcreek, UT property at 1221 East 3300 South include?
1221 East 3300 South in Millcreek includes 0.480 acres of land
What kind of Retail is the propery at 1221 East 3300 South?
The property at 1221 East 3300 South Millcreek, UT 84106 is listed as a Other Retail Retail property
What is the population within 1 mile of 1221 East 3300 South in Millcreek?
The population within 1 mile of 1221 East 3300 South Millcreek, UT 84106 is 19,060 people.
Who do I contact for questions about 1221 East 3300 South?
You should contact the listing agent,
Derek Klopfer, for any details regarding this commercial listing.