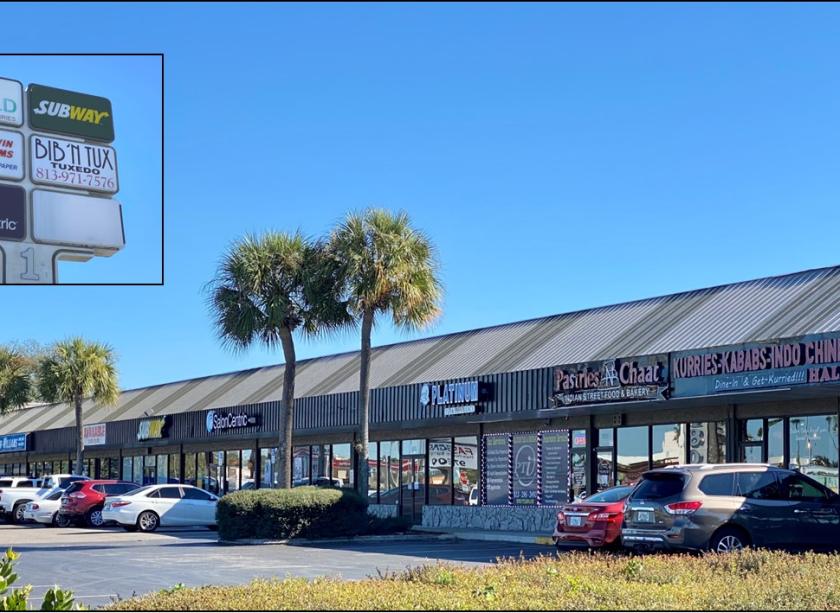
1-Mile | 3-Miles | 5-Miles | ||
---|---|---|---|---|
Total Population | 23,748 | 143,949 | 308,278 | |
Population Median Age | 34 | 35 | 37 | |
Population by Age | 0-9 Yrs | 3453 (14%) | 17349 (12%) | 37451 (12%) |
10-19 Yrs | 3442 (14%) | 19815 (13%) | 38407 (12%) | |
20-29 Yrs | 4304 (18%) | 32008 (22%) | 59156 (19%) | |
30-39 Yrs | 3490 (14%) | 19792 (13%) | 46150 (14%) | |
40-49 Yrs | 2851 (12%) | 15655 (10%) | 35283 (11%) | |
50-59 Yrs | 2582 (10%) | 15585 (10%) | 35874 (11%) | |
60-69 Yrs | 1897 (7%) | 13320 (9%) | 30620 (9%) | |
70+ Yrs | 1729 (7%) | 10425 (7%) | 25336 (8%) | |
Median HH Income | $29,494 | $35,653 | $43,655 | |
Total Household Income | < 24K | 3964 (44%) | 19583 (36%) | 32182 (27%) |
25-49K | 2881 (32%) | 16951 (31%) | 33835 (28%) | |
50-74K | 1231 (13%) | 8329 (15%) | 20905 (17%) | |
75-99K | 571 (6%) | 4582 (8%) | 11810 (10%) | |
100-199K | 243 (2%) | 4009 (7%) | 14047 (11%) | |
200K+ | 68 (0%) | 936 (1%) | 4635 (3%) | |
Highest Education Level | No Diploma | 3377 | 16208 | 27910 |
Diploma or GED | 5848 | 29710 | 61581 | |
Some College | 2653 | 15330 | 35548 | |
Assoc. Degree | 1075 | 8571 | 19730 | |
Bachelors Degree | 1453 | 12833 | 36659 | |
Higher Degree | 481 | 5234 | 19548 | |
Total Housing Units | 10,163 | 60,395 | 128,752 | |
--Owner-Occupied | 1,408 | 18,070 | 52,172 | |
--Renter-Occupied | 7,549 | 36,319 | 65,243 | |
Owner-Occupied Values | < 100K | 550 | 4925 | 9813 |
100-199K | 787 | 7479 | 17146 | |
200-299K | 38 | 3624 | 13816 | |
300-399K | 0 | 1022 | 5980 | |
400-499K | 23 | 495 | 2367 | |
500K+ | 9 | 525 | 3050 | |
Total Working Age Population | 18,519 | 117,657 | 251,096 | |
In Work Force | 10,684 | 71,891 | 161,812 | |
Not In Work Force | 7,835 | 45,766 | 89,284 | |
Workforce Employed | 9,490 | 65,623 | 150,739 | |
Workforce Unemployed | 1,160 | 6,178 | 10,739 | |
Civlian Workforce | 10,650 | 71,802 | 161,478 | |
Military Workforce | 34 | 89 | 334 | |
Total Households | 8,957 | 54,390 | 117,415 | |
Family Households | 4,265 | 25,450 | 62,828 | |
Non-Family Households | 4,692 | 28,939 | 54,587 | |
Married Couple | 1,564 | 12,969 | 36,186 | |
Other Family | 2,701 | 12,481 | 26,642 | |
Married w/Child | 716 | 5,230 | 13,535 | |
Single Male w/Child | 194 | 1,168 | 2,619 | |
Single Female w/Child | 1,272 | 5,724 | 11,129 |
Population Change Last Two Decades - Plus Projection
2000 | % | 2010 | % | 2020 | % | 2030 | |
---|---|---|---|---|---|---|---|
Florida | 15,982,378 | +18 | 18,801,310 | +14 | 21,517,610 | +13 | 24,340,457 |
Hillsborough County | 998,948 | +23 | 1,229,226 | +19 | 1,466,803 | +16 | 1,708,550 |
Total Working Age Population:
Total Households:
Total Working Age Population:
Total Households:
Total Working Age Population:
Total Households: