Industrial Properties
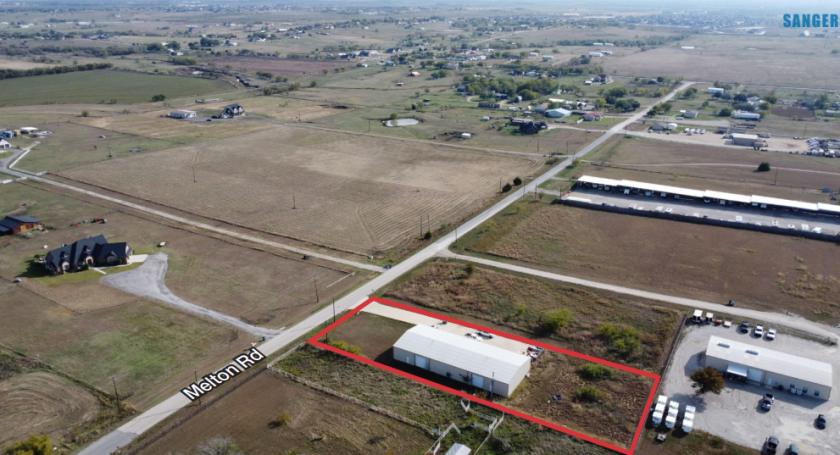
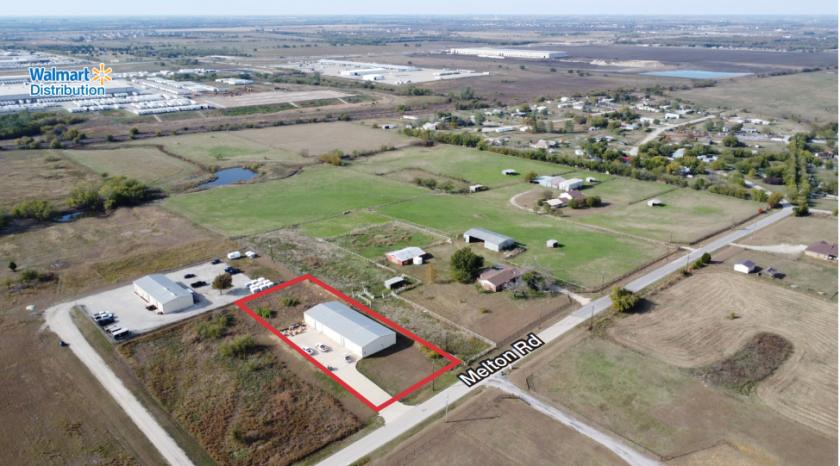
1685 Melton Road Sanger, TX 76266
1685 Melton Road Sanger, TX 76266
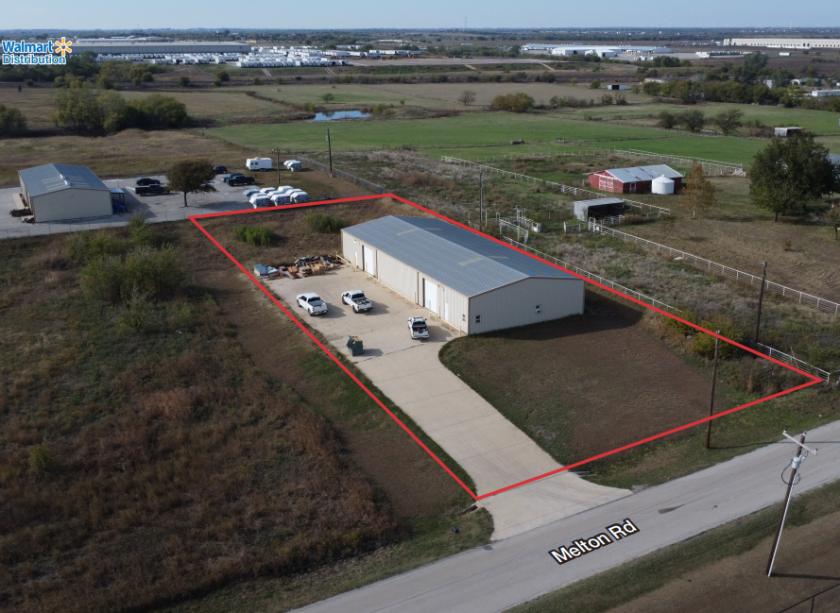
Details & Description
Property Highlights
- • Only 1 Mile from I-35
- • Rapidly Growing City of Sanger
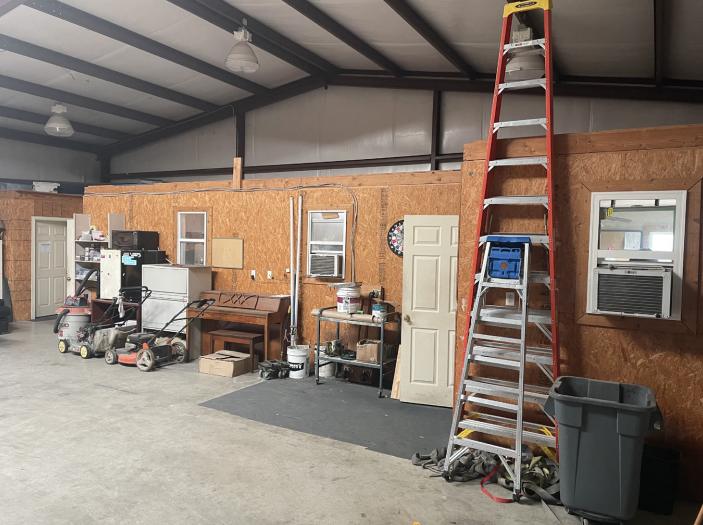
- • 500 SF Office
- • Year Built: 2009
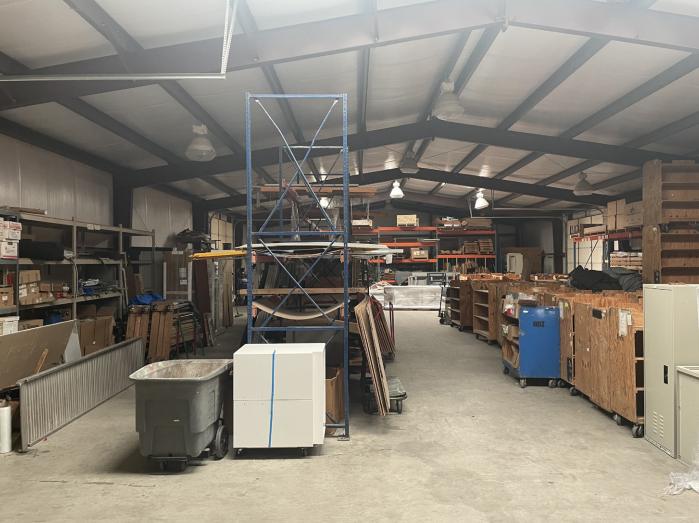
- • Clear Height: 14’-18’
Additional Photos
Listing Agents

Jeffry Jackson
O: 817-872-3910
M: 817-559-1991
jjackson@nairl.com
O: 817-872-3910
M: 817-559-1991
jjackson@nairl.com

Justin Glover
O: 817-872-3921
M: 832-630-8003
jglover@nairl.com
O: 817-872-3921
M: 832-630-8003
jglover@nairl.com
While we strive to provide the most accurate information, all listing information, and demographic data, is provided by third-parties. As such, MyEListing will not be responsible for the accuracy of the information. It is strongly recommended that you verify all information with the listing agent, and any relevant agencies, prior to making any decisions.


