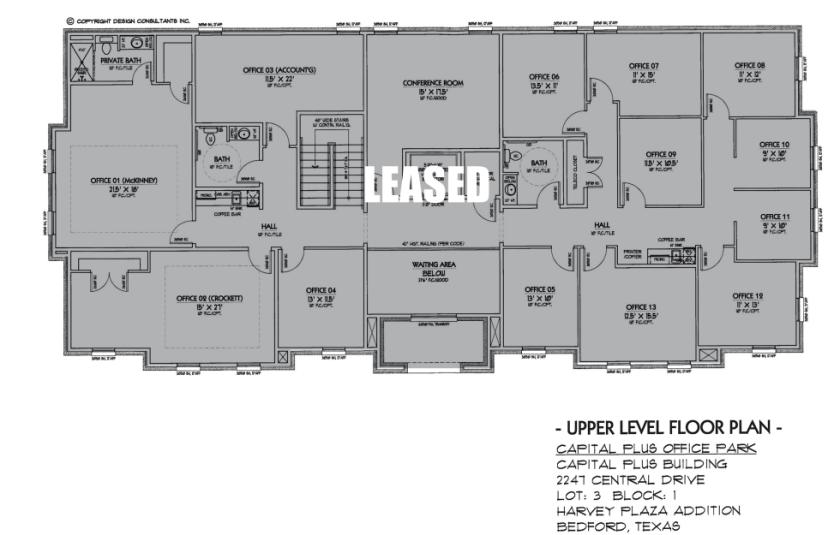
Office Space
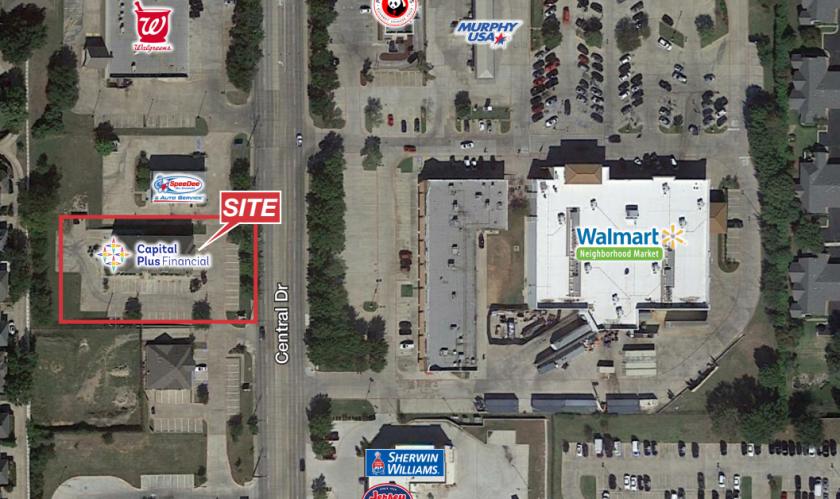
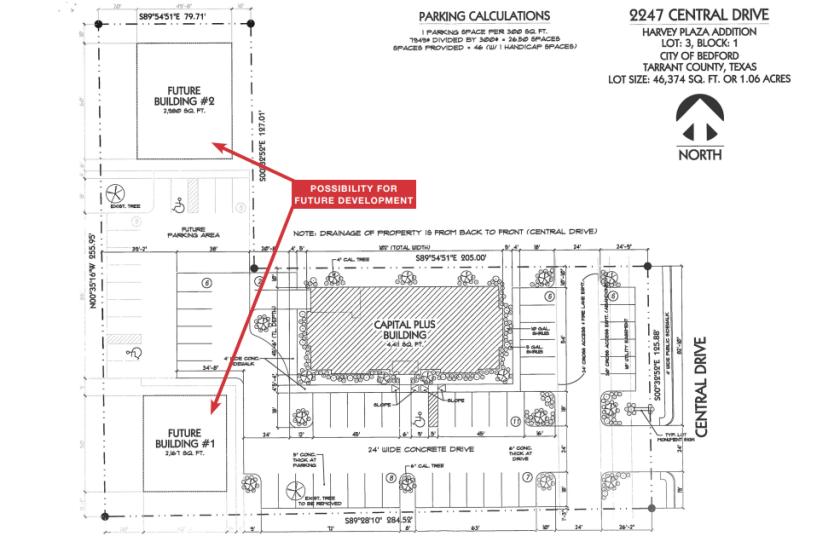
2247 Central Drive Bedford, TX 76021
2247 Central Drive Bedford, TX 76021
Details & Description
Property Highlights
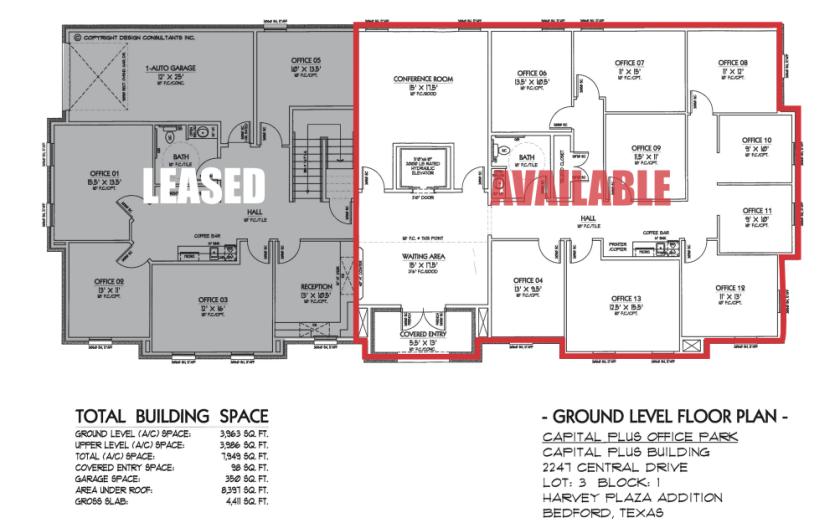
- • Ample Parking: Parking Ratio: 5/1,000
- • One (1) Auto Garage
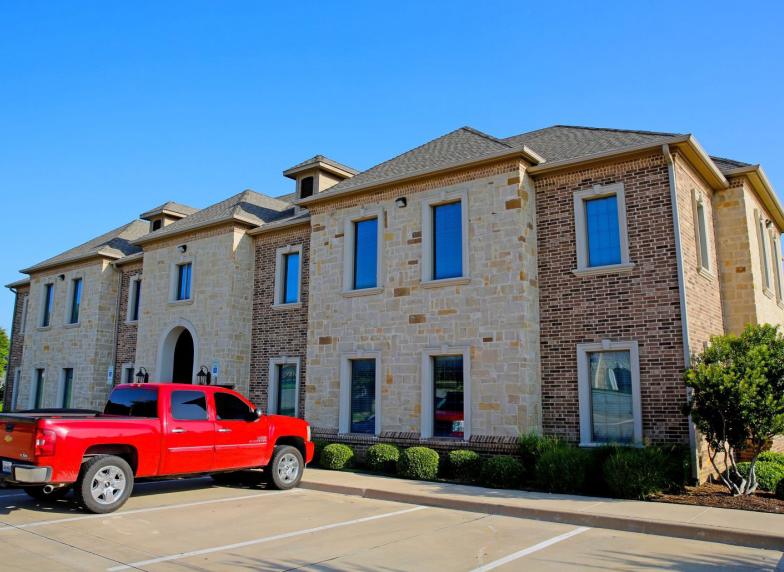
- • High End Finishes
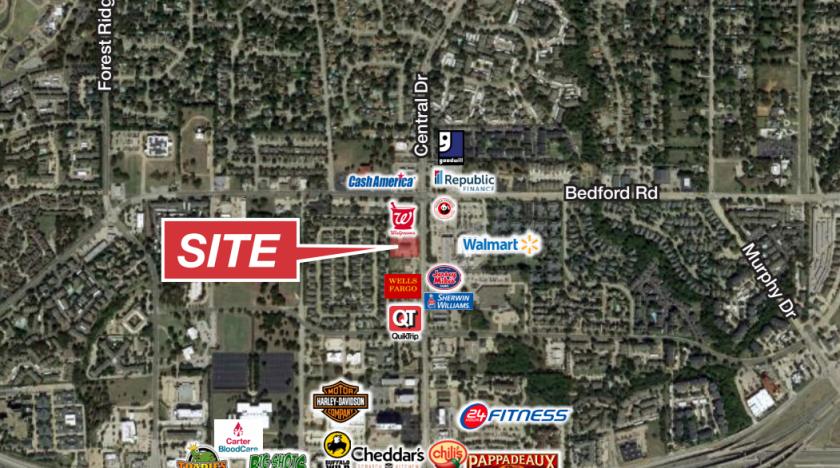
- • 9 Miles from DFW International Airport
- • Close Proximity to TX 183 and TX 121
Additional Photos

Listing Agents

Logan May
O: 817-872-3909
M: 325-642-4312
lmay@nairl.com
O: 817-872-3909
M: 325-642-4312
lmay@nairl.com

Jon McDaniel
O: 817-872-3902
M: 817-291-4451
jmcdaniel@nairl.com
O: 817-872-3902
M: 817-291-4451
jmcdaniel@nairl.com
While we strive to provide the most accurate information, all listing information, and demographic data, is provided by third-parties. As such, MyEListing will not be responsible for the accuracy of the information. It is strongly recommended that you verify all information with the listing agent, and any relevant agencies, prior to making any decisions.