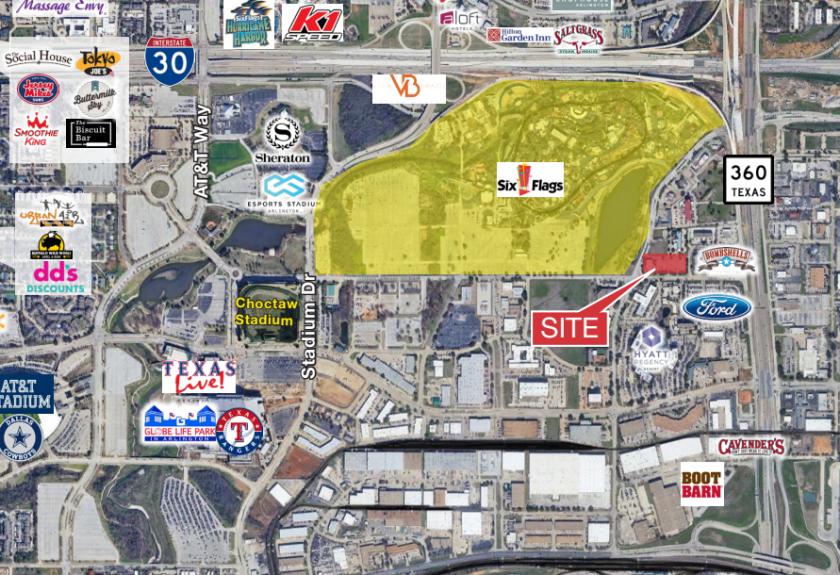
1-Mile | 3-Miles | 5-Miles | ||
---|---|---|---|---|
Total Population | 2,639 | 111,870 | 281,555 | |
Population Median Age | 31 | 33 | 34 | |
Population by Age | 0-9 Yrs | 460 (17%) | 17536 (15%) | 43740 (15%) |
10-19 Yrs | 297 (11%) | 15701 (14%) | 39719 (14%) | |
20-29 Yrs | 641 (24%) | 23184 (20%) | 52827 (18%) | |
30-39 Yrs | 389 (14%) | 16533 (14%) | 40883 (14%) | |
40-49 Yrs | 340 (12%) | 13853 (12%) | 35742 (12%) | |
50-59 Yrs | 220 (8%) | 11495 (10%) | 29319 (10%) | |
60-69 Yrs | 183 (6%) | 7888 (7%) | 21776 (7%) | |
70+ Yrs | 109 (4%) | 5680 (5%) | 17548 (6%) | |
Median HH Income | $41,264 | $46,198 | $50,559 | |
Total Household Income | < 24K | 304 (30%) | 9303 (21%) | 21065 (20%) |
25-49K | 277 (27%) | 13579 (31%) | 29406 (28%) | |
50-74K | 170 (16%) | 8673 (20%) | 20664 (20%) | |
75-99K | 135 (13%) | 5014 (11%) | 12438 (12%) | |
100-199K | 102 (10%) | 4793 (11%) | 15306 (15%) | |
200K+ | 15 (1%) | 1088 (2%) | 3093 (3%) | |
Highest Education Level | No Diploma | 334 | 15902 | 36703 |
Diploma or GED | 380 | 18266 | 46160 | |
Some College | 520 | 14436 | 37593 | |
Assoc. Degree | 149 | 4919 | 11912 | |
Bachelors Degree | 138 | 9835 | 27725 | |
Higher Degree | 62 | 4841 | 13751 | |
Total Housing Units | 1,122 | 47,569 | 112,963 | |
--Owner-Occupied | 150 | 12,690 | 39,736 | |
--Renter-Occupied | 854 | 29,760 | 62,235 | |
Owner-Occupied Values | < 100K | 11 | 3718 | 9221 |
100-199K | 57 | 4679 | 17743 | |
200-299K | 71 | 2597 | 8465 | |
300-399K | 10 | 804 | 2579 | |
400-499K | 1 | 582 | 1120 | |
500K+ | 0 | 310 | 608 | |
Total Working Age Population | 1,990 | 85,307 | 214,189 | |
In Work Force | 1,545 | 60,870 | 149,354 | |
Not In Work Force | 445 | 24,437 | 64,834 | |
Workforce Employed | 1,497 | 57,410 | 141,197 | |
Workforce Unemployed | 48 | 3,430 | 8,023 | |
Civlian Workforce | 1,545 | 60,840 | 149,220 | |
Military Workforce | 0 | 30 | 134 | |
Total Households | 1,003 | 42,451 | 101,972 | |
Family Households | 597 | 24,364 | 63,128 | |
Non-Family Households | 406 | 18,087 | 38,844 | |
Married Couple | 235 | 14,965 | 40,542 | |
Other Family | 363 | 9,400 | 22,586 | |
Married w/Child | 125 | 6,660 | 18,137 | |
Single Male w/Child | 43 | 1,205 | 3,122 | |
Single Female w/Child | 137 | 4,299 | 10,084 |
Population Change Last Two Decades - Plus Projection
2000 | % | 2010 | % | 2020 | % | 2030 | |
---|---|---|---|---|---|---|---|
Texas | 20,851,820 | +21 | 25,145,561 | +18 | 29,677,668 | +18 | 34,894,452 |
Tarrant County | 1,446,219 | +25 | 1,809,034 | +19 | 2,143,755 | +17 | 2,507,170 |
Dallas County | 2,218,899 | +7 | 2,368,139 | +15 | 2,734,111 | +14 | 3,106,298 |
Total Working Age Population:
Total Households:
Total Working Age Population:
Total Households:
Total Working Age Population:
Total Households: