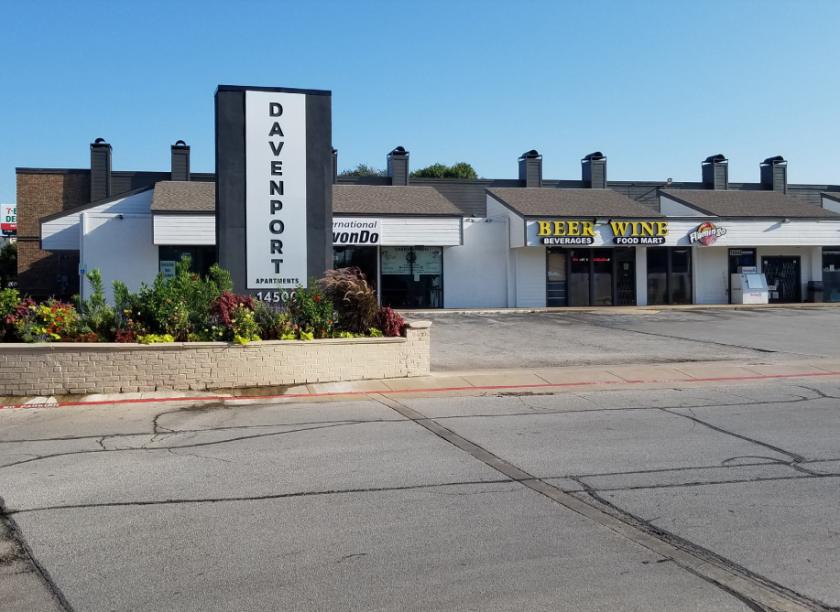
Retail Space
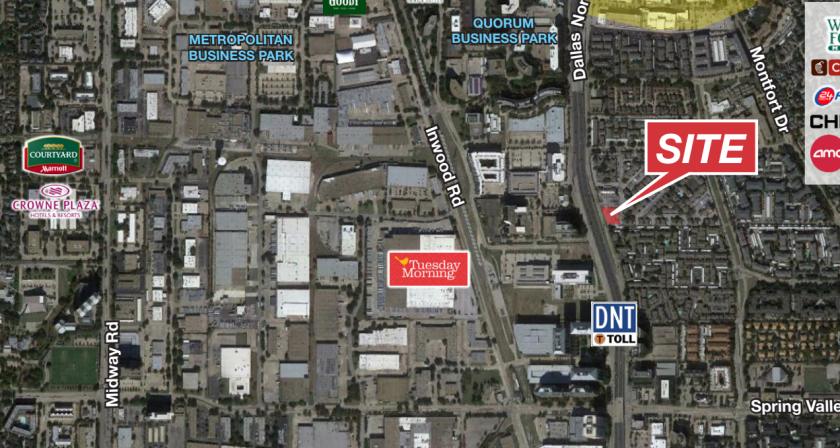
14500 Dallas Parkway Dallas, TX 75254
14500 Dallas Parkway Dallas, TX 75254
Details & Description
Property Highlights
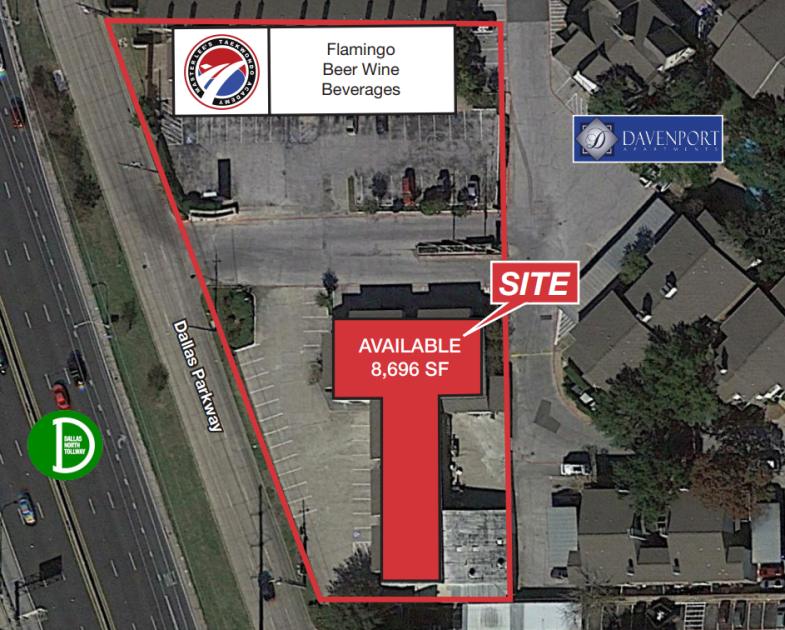
- • 8,696 SF Total Contiguous Space Available
- • DNT Tollway Visibility
- • Easy Access and Excellent Visibility
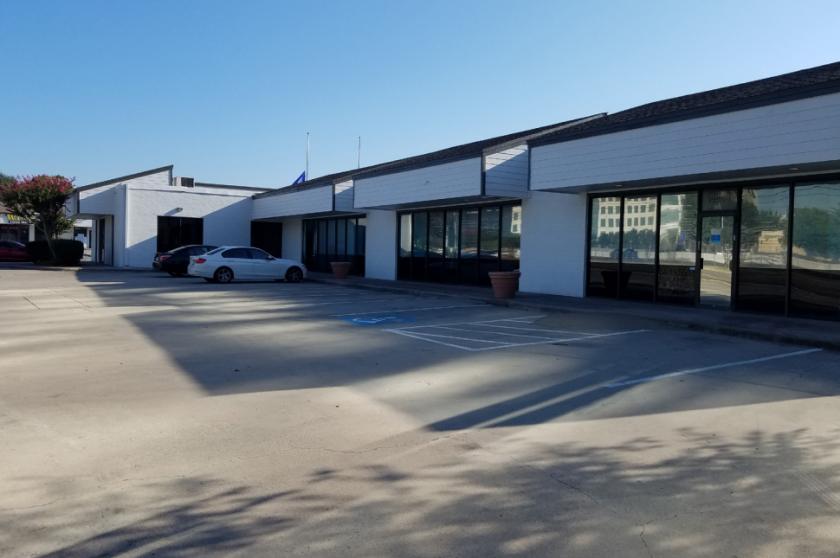
Additional Photos
Listing Agents

Lanie Richards
O: 214-256-7187
M: 817-691-7928
lrichards@nairl.com
O: 214-256-7187
M: 817-691-7928
lrichards@nairl.com
While we strive to provide the most accurate information, all listing information, and demographic data, is provided by third-parties. As such, MyEListing will not be responsible for the accuracy of the information. It is strongly recommended that you verify all information with the listing agent, and any relevant agencies, prior to making any decisions.


