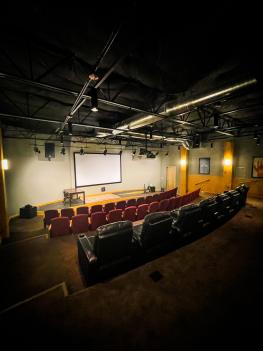
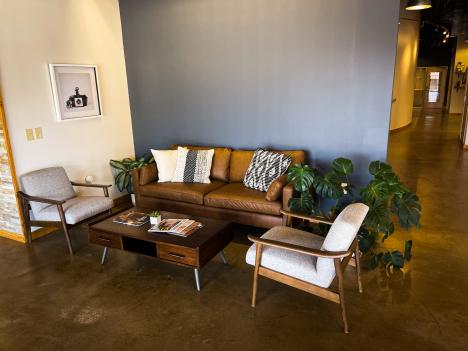
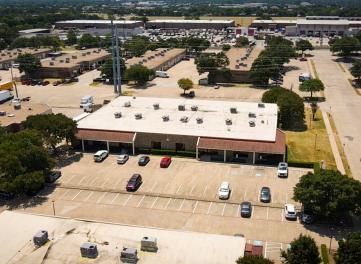
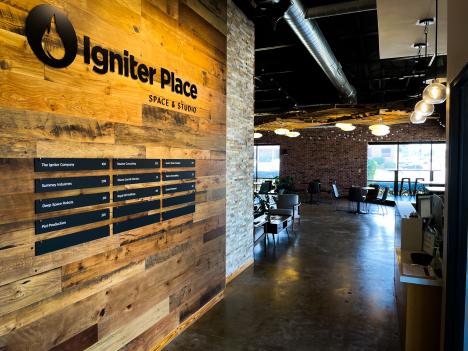
Office Space
710 Presidential Drive Richardson, TX 75081
710 Presidential Drive Richardson, TX 75081
Details & Description
Property Highlights
- • Building Class: B
- • PARKING 3.25:1000
- • ZONING F1 OFFICE COMMERCIAL
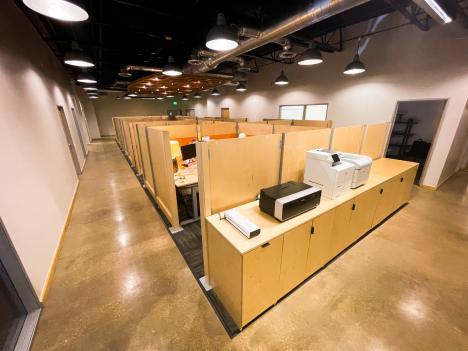
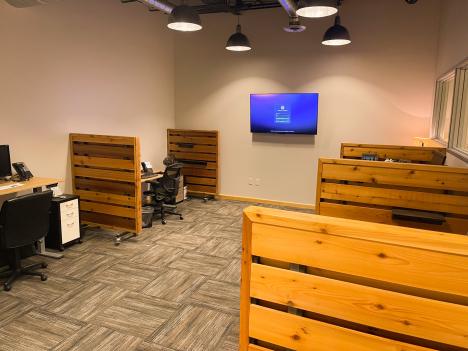
- • 38 PRIVATE OFFICES
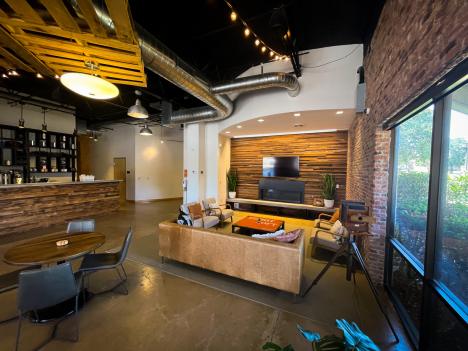
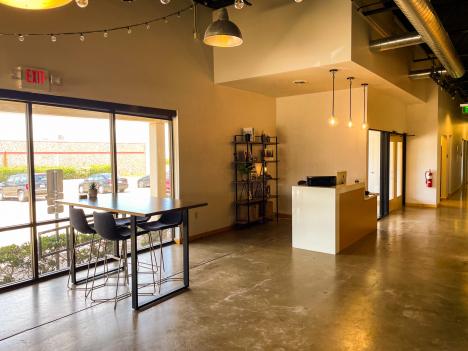
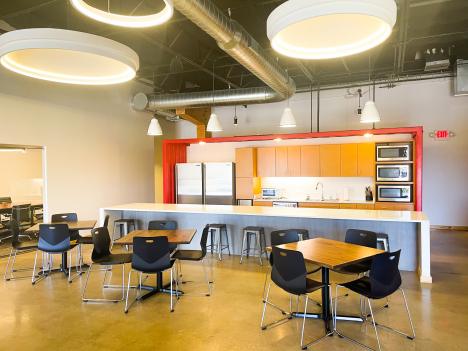
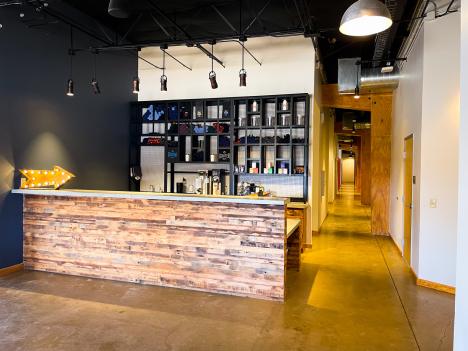
- • 1 COFFEE BAR
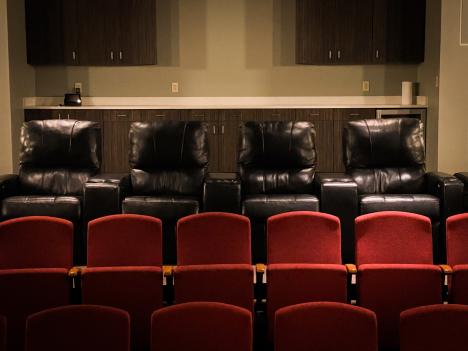
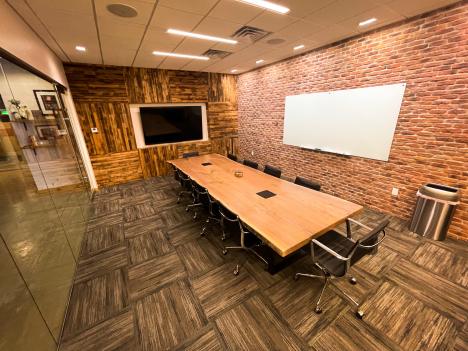
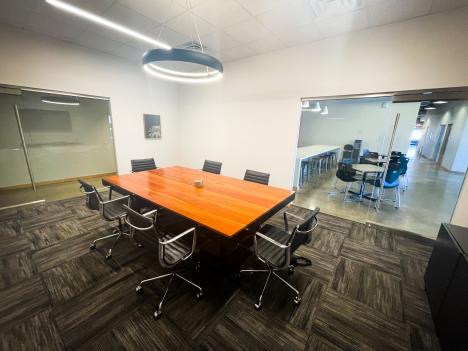
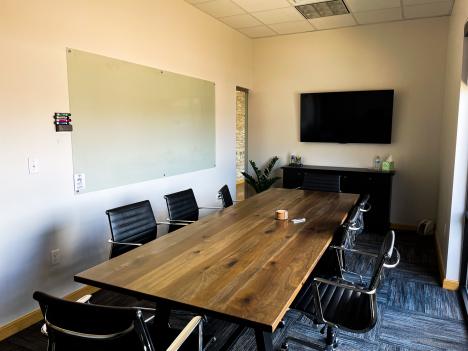
- • 4 CONFERENCE ROOMS
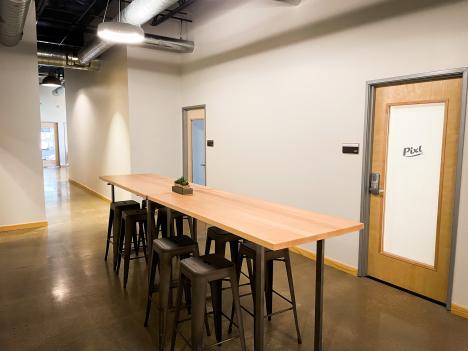
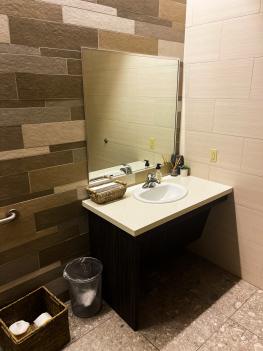
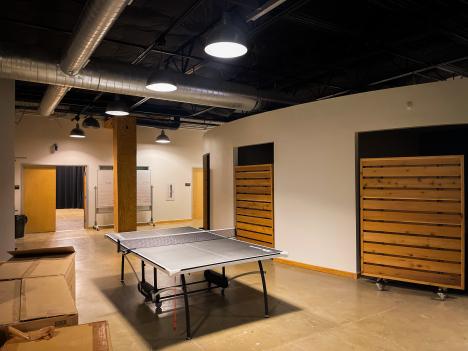
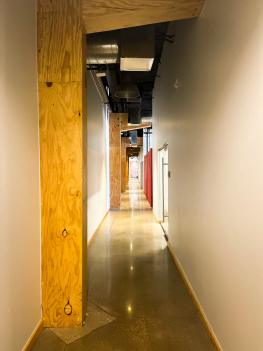
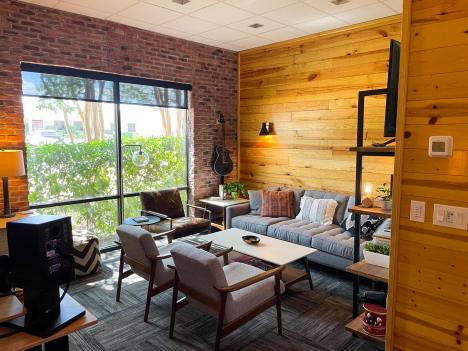
Additional Photos

Listing Agents

Kent Smith
O: 214-256-7102
M: 972-529-8499
ksmith@nairl.com
O: 214-256-7102
M: 972-529-8499
ksmith@nairl.com
While we strive to provide the most accurate information, all listing information, and demographic data, is provided by third-parties. As such, MyEListing will not be responsible for the accuracy of the information. It is strongly recommended that you verify all information with the listing agent, and any relevant agencies, prior to making any decisions.