Flex-Office-Warehouse
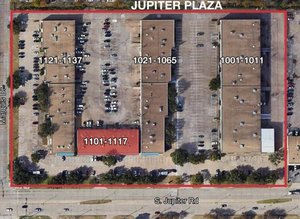
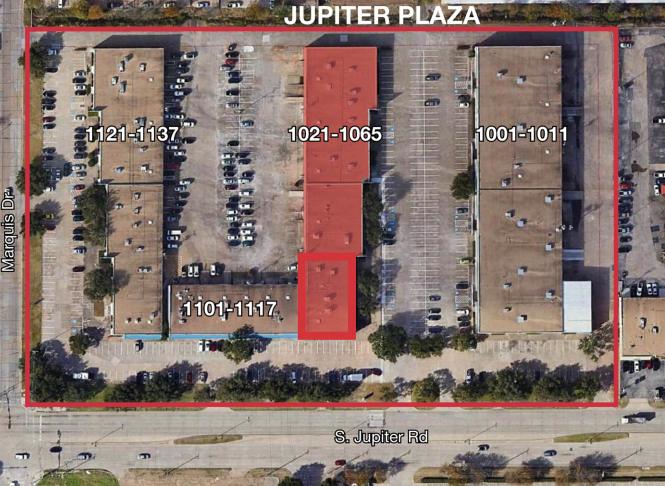
1021 - 1065 S Jupiter Rd Garland, TX 75042
1021 - 1065 S Jupiter Rd Garland, TX 75042
Details & Description
Property Highlights
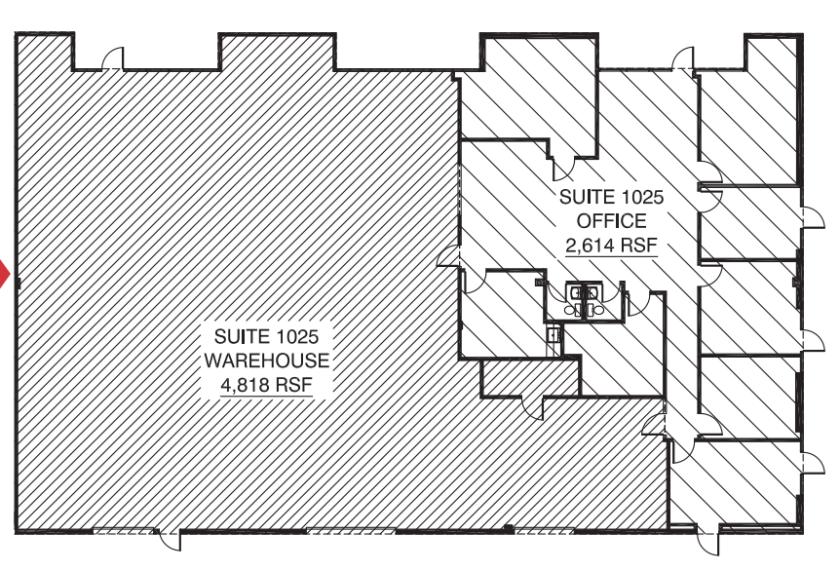
- • 2,614 SF Office
- • 100% Air Conditioned
- • 15’ Clear Height
Listing Agents

Stephen Cooper
O: 214-256-7160
M: 214-497-0730
scooper@nairl.com
O: 214-256-7160
M: 214-497-0730
scooper@nairl.com
While we strive to provide the most accurate information, all listing information, and demographic data, is provided by third-parties. As such, MyEListing will not be responsible for the accuracy of the information. It is strongly recommended that you verify all information with the listing agent, and any relevant agencies, prior to making any decisions.