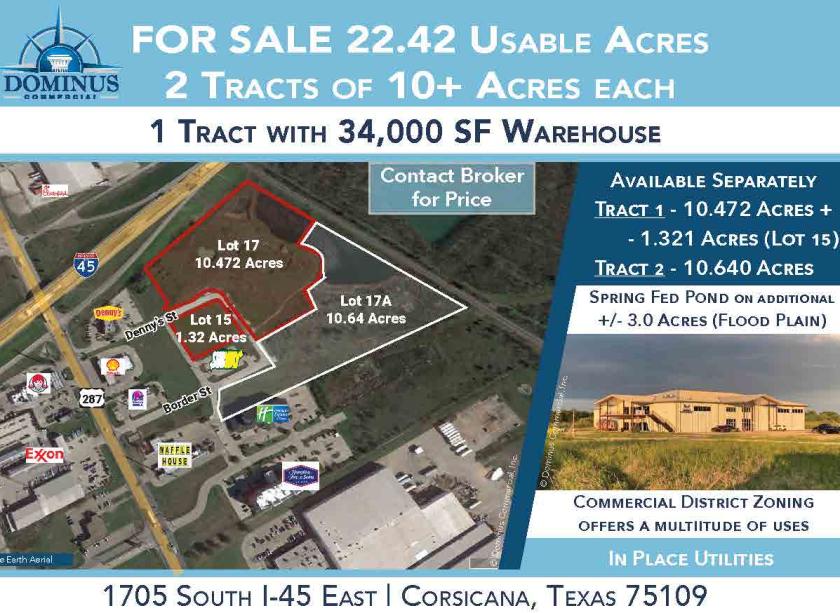
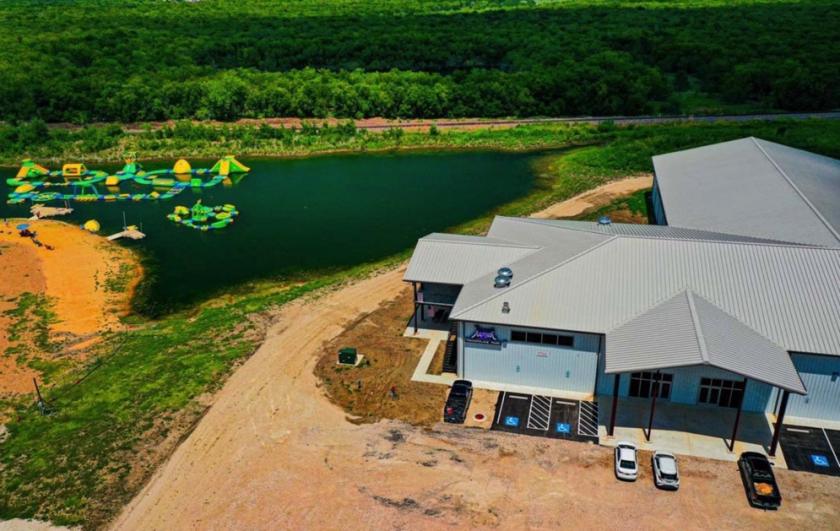
Flex-Office-Warehouse
1701 North 45th Street Corsicana, TX 75110
1701 North 45th Street Corsicana, TX 75110
Details & Description
Property Highlights
- • Great owner/user or redevelopment opportunity
- • FF&E is still in place
- • Opportunity Zone
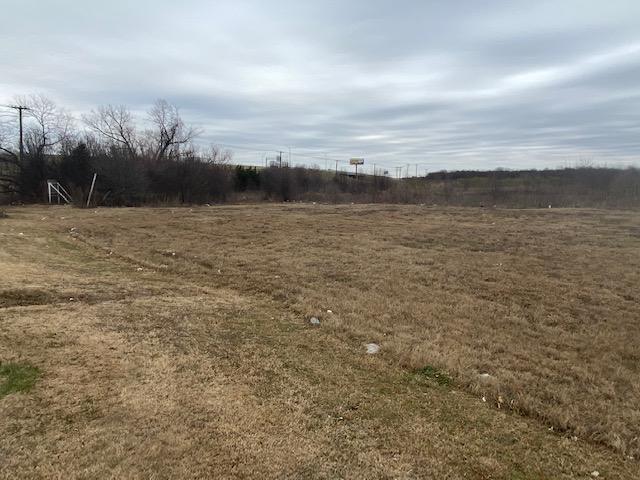
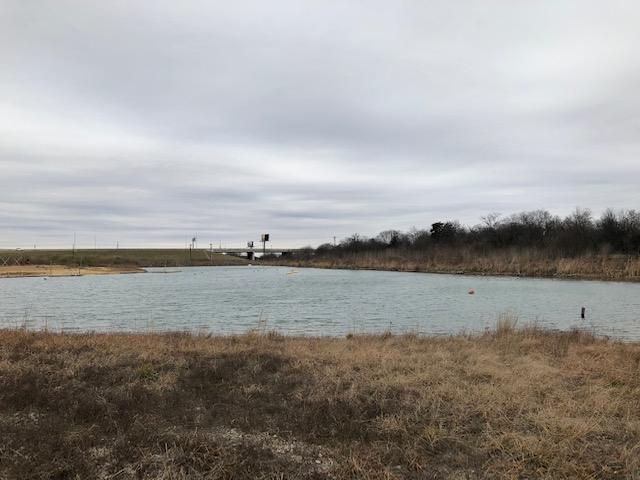
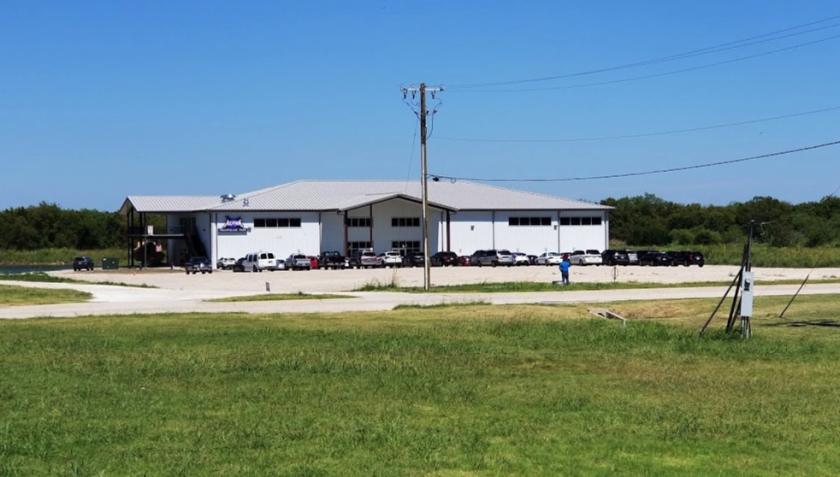
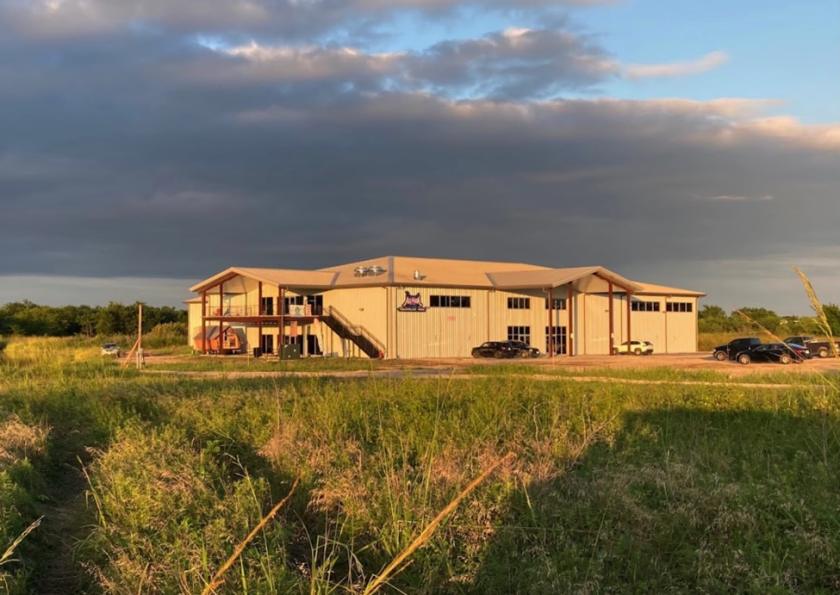
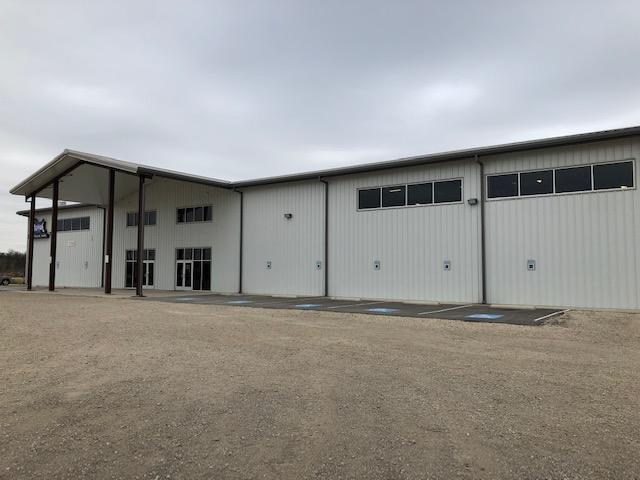
Additional Photos
Listing Agents

Justin Owen
O: 214-253-0797
jowen@dominuscommercial.com
O: 214-253-0797
jowen@dominuscommercial.com
While we strive to provide the most accurate information, all listing information, and demographic data, is provided by third-parties. As such, MyEListing will not be responsible for the accuracy of the information. It is strongly recommended that you verify all information with the listing agent, and any relevant agencies, prior to making any decisions.