Industrial Properties
1232 Crowley Drive Carrollton, TX 75006
1232 Crowley Drive Carrollton, TX 75006
Details & Description
Property Highlights
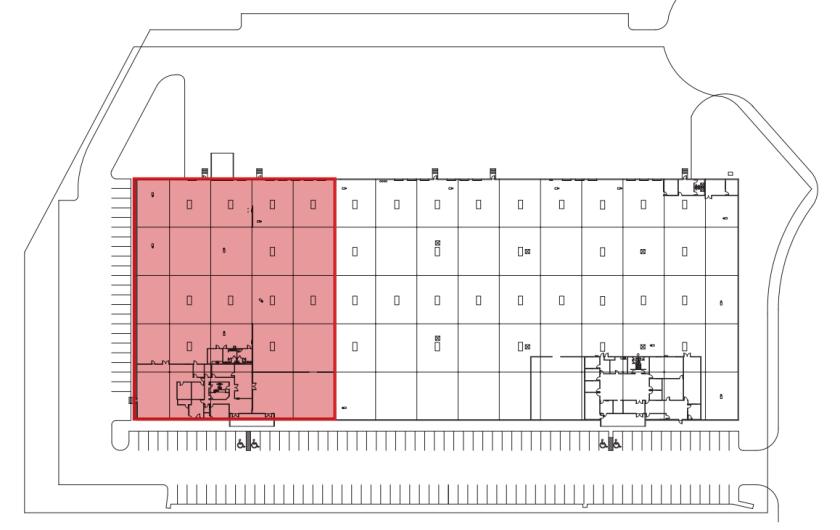
- • Suite 148
- • 5,000 SF Office
- • 24’ Clear Height
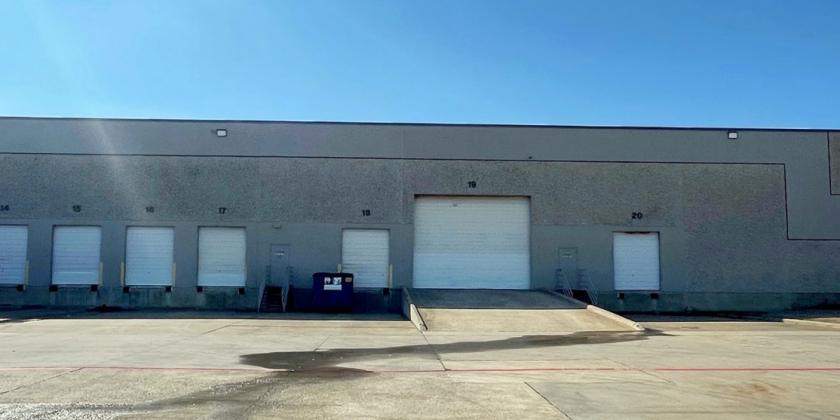
- • 7 Dock High Doors
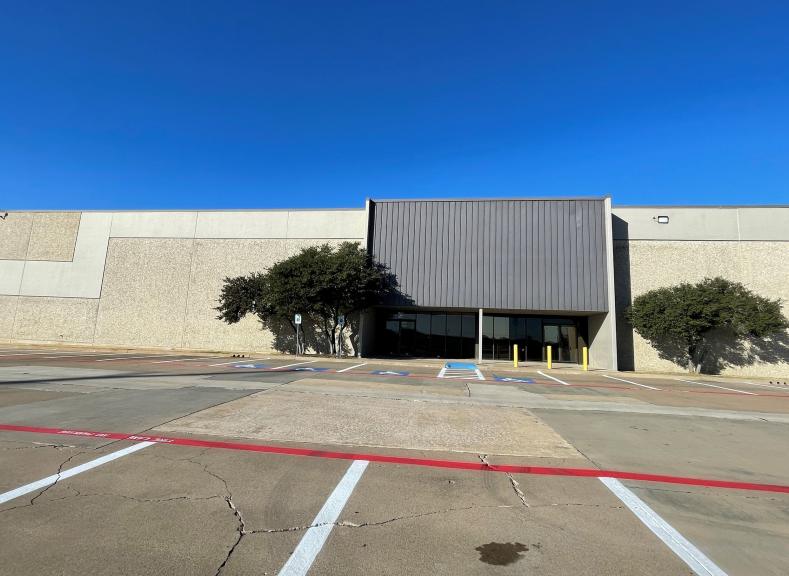
- • 44 Car Parks
- • 5-Year+ Sublease
Listing Agents

Mark Miller
O: 214-256-7119
M: 214-537-9940
mmiller@nairl.com
O: 214-256-7119
M: 214-537-9940
mmiller@nairl.com

Becky Miller
O: 214-256-7107
M: 214-228-3451
bmiller@nairl.com
O: 214-256-7107
M: 214-228-3451
bmiller@nairl.com
While we strive to provide the most accurate information, all listing information, and demographic data, is provided by third-parties. As such, MyEListing will not be responsible for the accuracy of the information. It is strongly recommended that you verify all information with the listing agent, and any relevant agencies, prior to making any decisions.