Industrial Properties
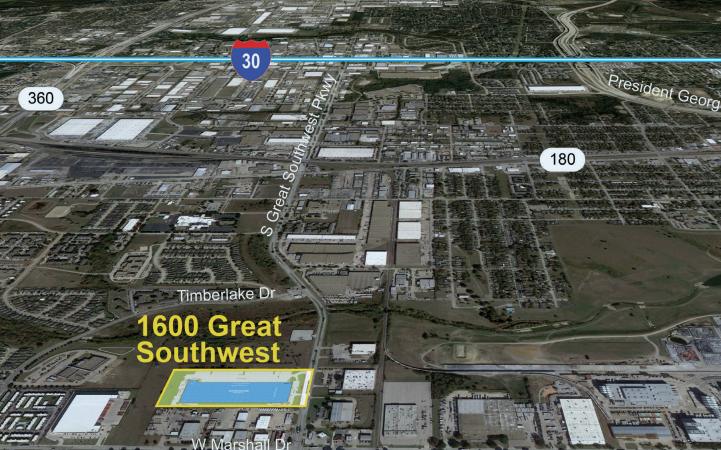
1600 South Great Southwest Parkway Grand Prairie, TX 75051
1600 South Great Southwest Parkway Grand Prairie, TX 75051
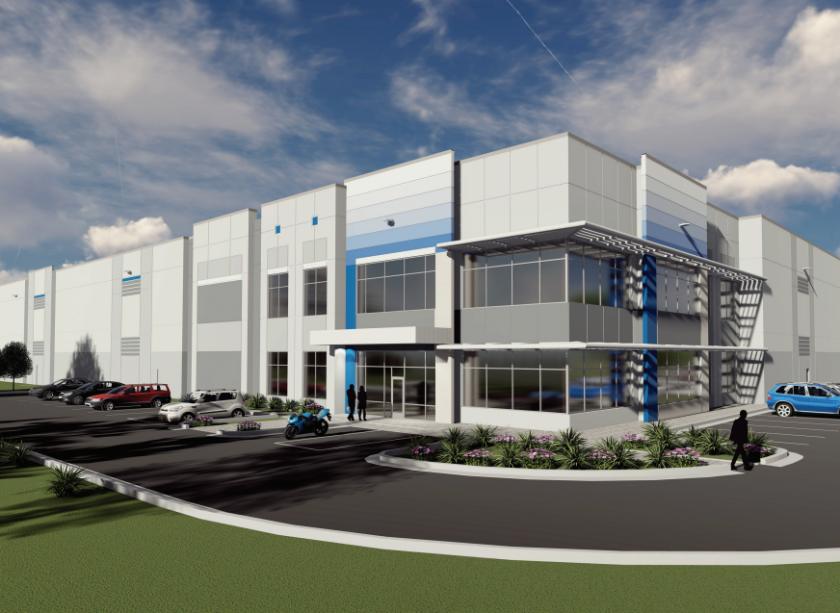
Details & Description
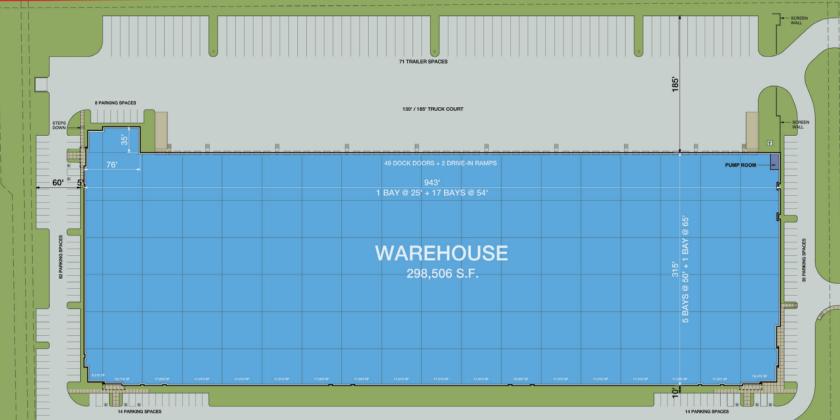
Property Highlights
- • OFFICE AREA: Build to suit
- • CLEAR HEIGHT: 36’
- • DOCKS: 48
- • DRIVE-IN DOORS: 2
- • TRUCK COURT: 130’ / 185’
- • AUTO PARKING: 133 spaces
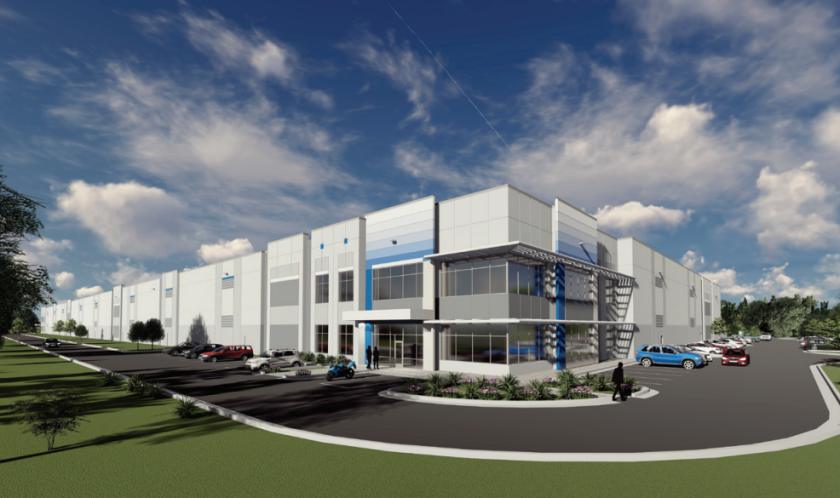
Additional Photos
Listing Agents

Rick Medinis
O: 214-543-1248
M: 214-256-7116
rmedinis@nairl.com
O: 214-543-1248
M: 214-256-7116
rmedinis@nairl.com

Tyson Erwin
O: 214-256-7127
M: 214-514-6993
terwin@nairl.com
O: 214-256-7127
M: 214-514-6993
terwin@nairl.com
While we strive to provide the most accurate information, all listing information, and demographic data, is provided by third-parties. As such, MyEListing will not be responsible for the accuracy of the information. It is strongly recommended that you verify all information with the listing agent, and any relevant agencies, prior to making any decisions.


