Office Space
1120 South 6th Street St Louis, MO 63104
1120 South 6th Street St Louis, MO 63104
Details & Description
Property Highlights
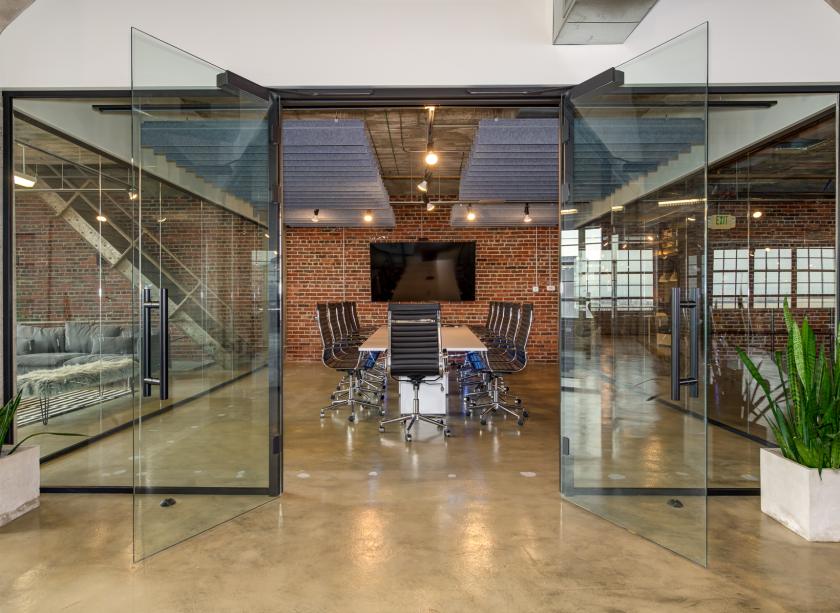
• 2021 Renovated with glass offices, glass conference room, coffee bar, restrooms
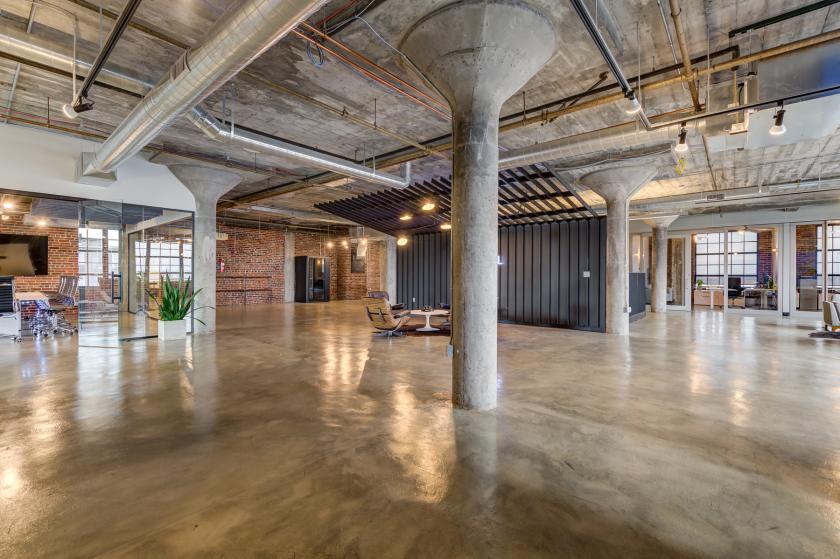
• 12' ceilings, heavy timber and mushroom capital columns
Additional Photos


Listing Agents

Stewart Ryckman
1120southsixth@gmail.com
1120southsixth@gmail.com
While we strive to provide the most accurate information, all listing information, and demographic data, is provided by third-parties. As such, MyEListing will not be responsible for the accuracy of the information. It is strongly recommended that you verify all information with the listing agent, and any relevant agencies, prior to making any decisions.


