Industrial Properties
6935 Reames Road Charlotte, NC 28216
6935 Reames Road Charlotte, NC 28216

Details & Description
Property Highlights
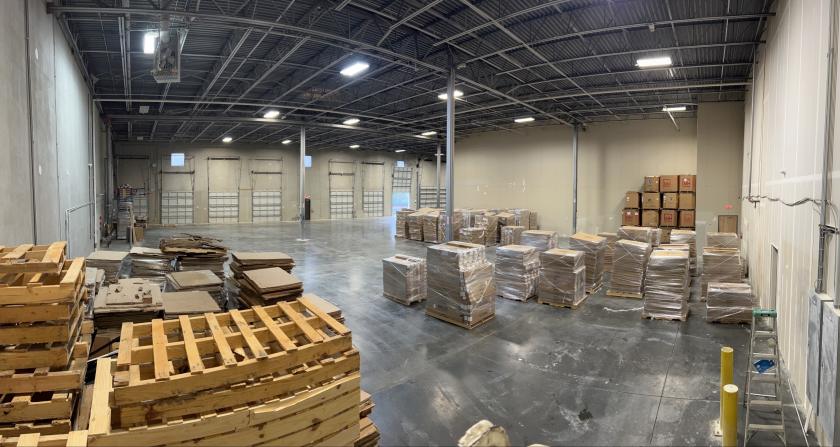
- • high ceilings 24'
- • 7 high docs
- • 1 drive in
- • private kitchen and bathroom
Additional Photos


Listing Agents

Kayla Wallace
kayla.wallace@nychbrands.com
kayla.wallace@nychbrands.com
While we strive to provide the most accurate information, all listing information, and demographic data, is provided by third-parties. As such, MyEListing will not be responsible for the accuracy of the information. It is strongly recommended that you verify all information with the listing agent, and any relevant agencies, prior to making any decisions.


