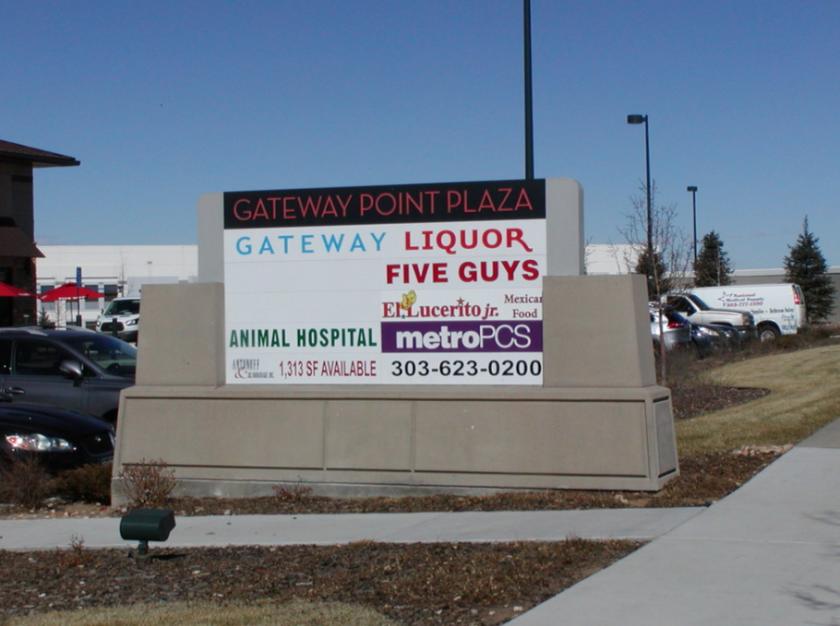
Retail Space
3751 Tower Road Aurora, CO 80011
3751 Tower Road Aurora, CO 80011

Details & Description
Property Highlights
• Located in Gateway Park Development with 5 million sf of commercial space and 40+ national retailers
• Estimated Labor Population for 2017 is 116,574 in a 5 mile radius from this corner
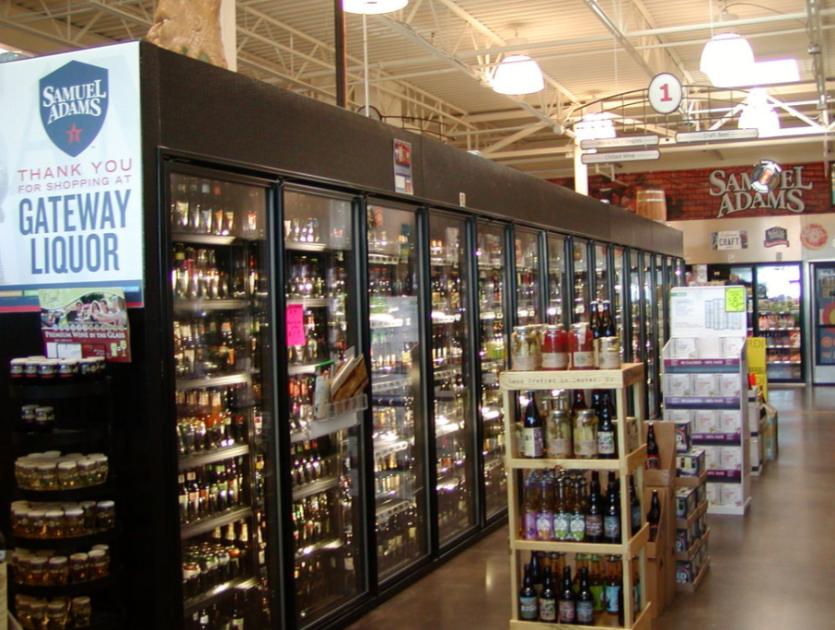
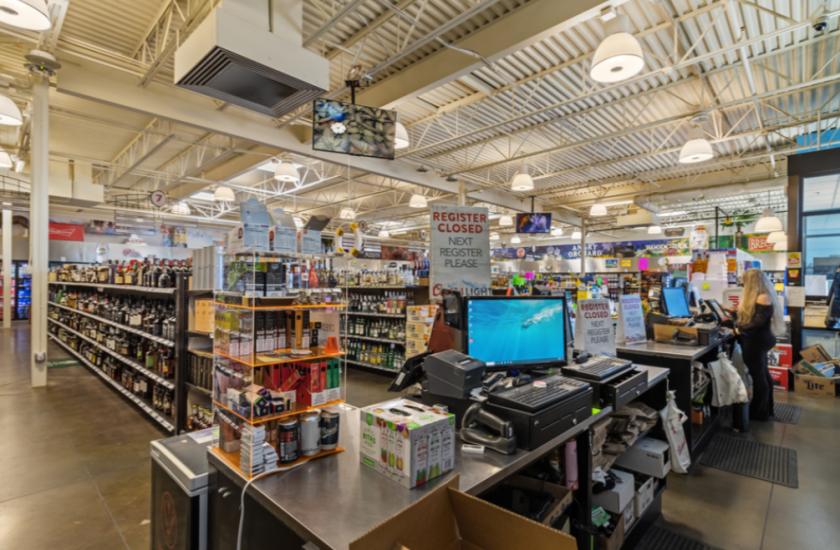
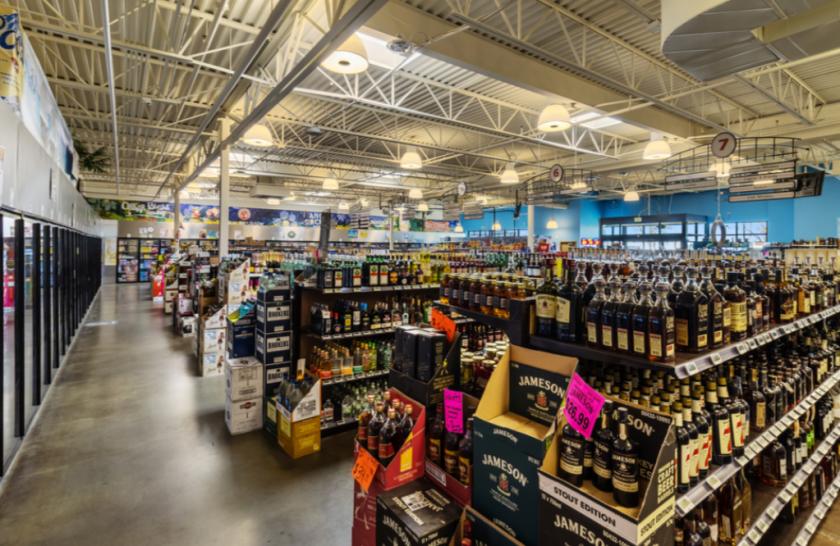
Additional Photos


Listing Agents

Jeffrey Hirschfeld
O: 303-454-5425
jhirschfeld@antonoff.com
O: 303-454-5425
jhirschfeld@antonoff.com
While we strive to provide the most accurate information, all listing information, and demographic data, is provided by third-parties. As such, MyEListing will not be responsible for the accuracy of the information. It is strongly recommended that you verify all information with the listing agent, and any relevant agencies, prior to making any decisions.