Flex-Office-Warehouse
2 Perry Street Stoughton, MA 02072
2 Perry Street Stoughton, MA 02072

Details & Description
Property Highlights
- • Two grade-level loading doors
- • Six – eight parking spots
- • Annual Real Estate Tax: $5,800
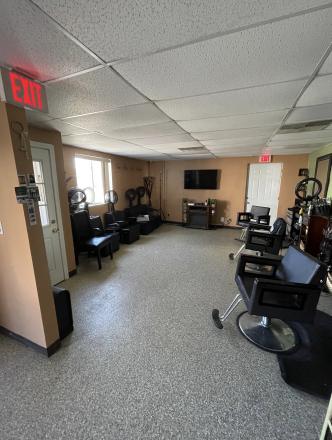
- • 1,343 vacant shop space
- • $395,000
Additional Photos


Listing Agents

JP Plunkett
M: 617-999-4993
plunkett@r-dome.com
M: 617-999-4993
plunkett@r-dome.com
While we strive to provide the most accurate information, all listing information, and demographic data, is provided by third-parties. As such, MyEListing will not be responsible for the accuracy of the information. It is strongly recommended that you verify all information with the listing agent, and any relevant agencies, prior to making any decisions.


