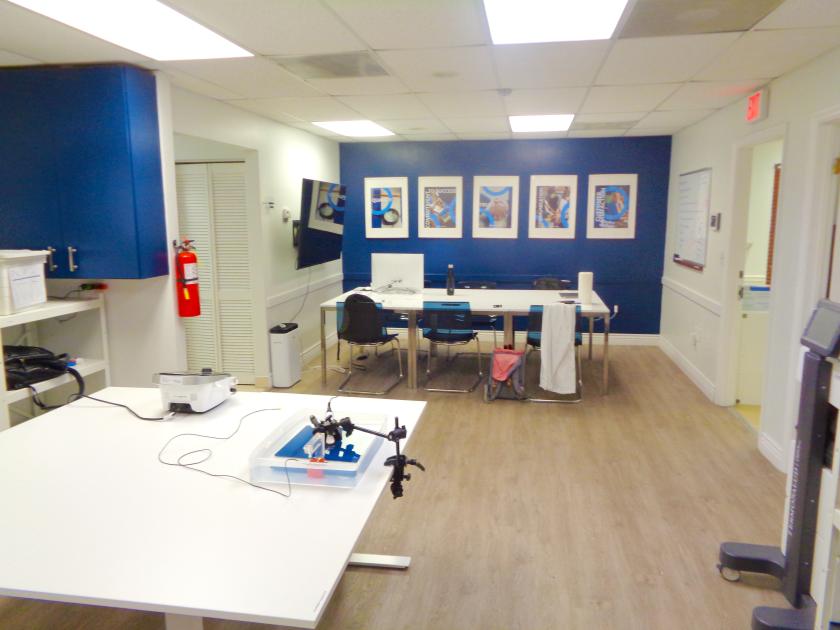
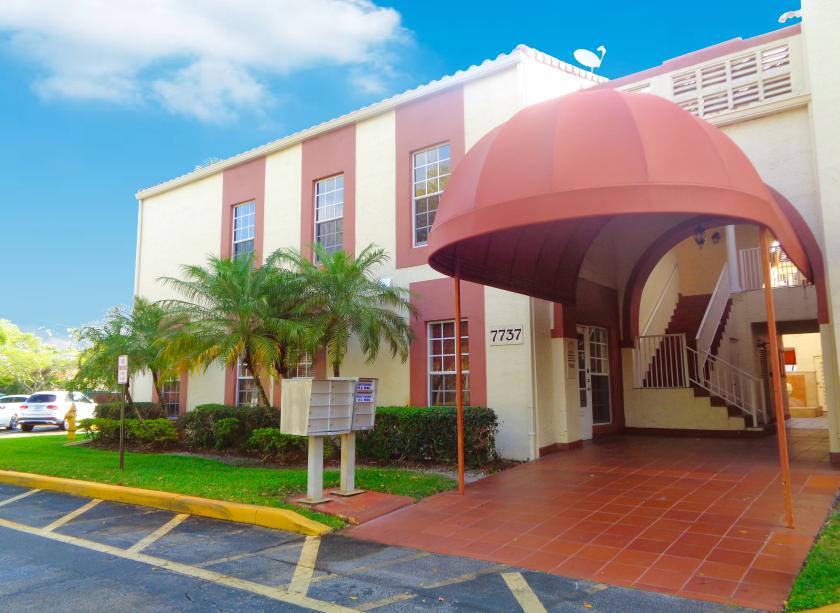
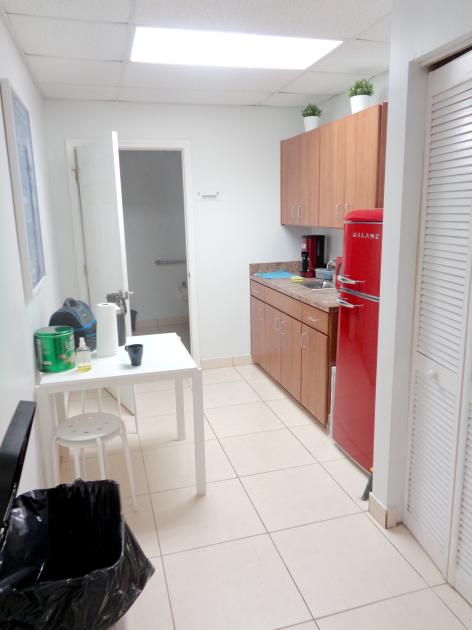
1-Mile | 3-Miles | 5-Miles | ||
---|---|---|---|---|
Total Population | 16,871 | 175,076 | 421,784 | |
Population Median Age | 40 | 41 | 41 | |
Population by Age | 0-9 Yrs | 1372 (8%) | 19078 (10%) | 49233 (11%) |
10-19 Yrs | 2507 (14%) | 20218 (11%) | 49937 (11%) | |
20-29 Yrs | 2161 (12%) | 21633 (12%) | 52375 (12%) | |
30-39 Yrs | 1981 (11%) | 22570 (12%) | 56139 (13%) | |
40-49 Yrs | 2205 (13%) | 22415 (12%) | 52450 (12%) | |
50-59 Yrs | 3217 (19%) | 24630 (14%) | 56239 (13%) | |
60-69 Yrs | 1743 (10%) | 21150 (12%) | 51940 (12%) | |
70+ Yrs | 1685 (9%) | 23382 (13%) | 53470 (12%) | |
Median HH Income | $61,890 | $55,717 | $52,705 | |
Total Household Income | < 24K | 1000 (16%) | 12245 (18%) | 33636 (21%) |
25-49K | 1258 (20%) | 16990 (25%) | 40549 (26%) | |
50-74K | 1471 (24%) | 13187 (20%) | 30885 (19%) | |
75-99K | 870 (14%) | 8013 (12%) | 18584 (11%) | |
100-199K | 1223 (20%) | 12730 (19%) | 26880 (17%) | |
200K+ | 271 (4%) | 2323 (3%) | 5190 (3%) | |
Highest Education Level | No Diploma | 972 | 13556 | 35125 |
Diploma or GED | 3303 | 38350 | 91037 | |
Some College | 2464 | 25122 | 60979 | |
Assoc. Degree | 1637 | 14042 | 32288 | |
Bachelors Degree | 2313 | 22965 | 53900 | |
Higher Degree | 1282 | 11674 | 25928 | |
Total Housing Units | 6,924 | 72,261 | 176,004 | |
--Owner-Occupied | 4,154 | 45,260 | 100,311 | |
--Renter-Occupied | 1,939 | 20,228 | 55,414 | |
Owner-Occupied Values | < 100K | 548 | 7449 | 22176 |
100-199K | 1221 | 11573 | 24523 | |
200-299K | 1406 | 13433 | 25847 | |
300-399K | 476 | 7496 | 17919 | |
400-499K | 224 | 3562 | 6497 | |
500K+ | 279 | 1746 | 3350 | |
Total Working Age Population | 14,109 | 143,772 | 341,836 | |
In Work Force | 10,022 | 96,209 | 225,700 | |
Not In Work Force | 4,087 | 47,563 | 116,136 | |
Workforce Employed | 9,430 | 89,763 | 211,247 | |
Workforce Unemployed | 591 | 6,403 | 14,263 | |
Civlian Workforce | 10,021 | 96,165 | 225,510 | |
Military Workforce | 1 | 44 | 190 | |
Total Households | 6,093 | 65,488 | 155,725 | |
Family Households | 3,964 | 41,844 | 98,476 | |
Non-Family Households | 2,129 | 23,645 | 57,249 | |
Married Couple | 2,333 | 27,266 | 63,473 | |
Other Family | 1,631 | 14,578 | 35,003 | |
Married w/Child | 912 | 9,694 | 22,801 | |
Single Male w/Child | 91 | 1,426 | 3,636 | |
Single Female w/Child | 476 | 4,889 | 12,191 |
Population Change Last Two Decades - Plus Projection
2000 | % | 2010 | % | 2020 | % | 2030 | |
---|---|---|---|---|---|---|---|
Florida | 15,982,378 | +18 | 18,801,310 | +14 | 21,517,610 | +13 | 24,340,457 |
Broward County | 1,623,018 | +8 | 1,748,066 | +11 | 1,942,686 | +9 | 2,120,334 |
Total Working Age Population:
Total Households:
Total Working Age Population:
Total Households:
Total Working Age Population:
Total Households: