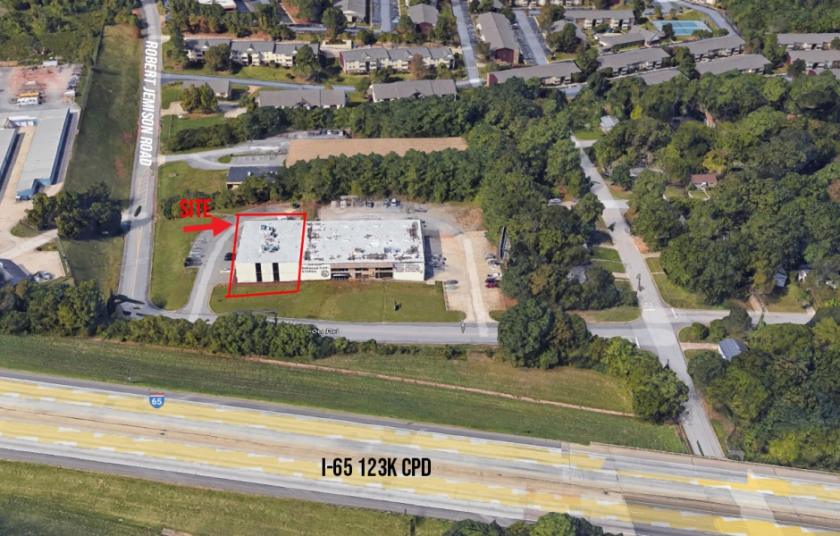
1-Mile | 3-Miles | 5-Miles | ||
---|---|---|---|---|
Total Population | 10,547 | 78,946 | 186,066 | |
Population Median Age | 36 | 36 | 38 | |
Population by Age | 0-9 Yrs | 1281 (12%) | 8730 (11%) | 20774 (11%) |
10-19 Yrs | 927 (8%) | 10007 (12%) | 23158 (12%) | |
20-29 Yrs | 2717 (25%) | 18367 (23%) | 34429 (18%) | |
30-39 Yrs | 1748 (16%) | 10240 (12%) | 25003 (13%) | |
40-49 Yrs | 776 (7%) | 8088 (10%) | 20636 (11%) | |
50-59 Yrs | 1078 (10%) | 8469 (10%) | 21195 (11%) | |
60-69 Yrs | 1179 (11%) | 8043 (10%) | 22291 (11%) | |
70+ Yrs | 840 (7%) | 7001 (8%) | 18580 (9%) | |
Median HH Income | $39,982 | $43,550 | $47,959 | |
Total Household Income | < 24K | 1255 (24%) | 9919 (28%) | 22083 (28%) |
25-49K | 1772 (35%) | 8768 (25%) | 18361 (23%) | |
50-74K | 937 (18%) | 5585 (16%) | 12221 (15%) | |
75-99K | 366 (7%) | 2762 (8%) | 6753 (8%) | |
100-199K | 674 (13%) | 5348 (15%) | 12436 (15%) | |
200K+ | 51 (1%) | 2055 (5%) | 7003 (8%) | |
Highest Education Level | No Diploma | 830 | 4854 | 12032 |
Diploma or GED | 1789 | 11262 | 27717 | |
Some College | 1462 | 9773 | 23694 | |
Assoc. Degree | 540 | 3264 | 8493 | |
Bachelors Degree | 1610 | 12232 | 30922 | |
Higher Degree | 994 | 9784 | 22843 | |
Total Housing Units | 6,988 | 43,899 | 97,097 | |
--Owner-Occupied | 2,104 | 15,134 | 40,313 | |
--Renter-Occupied | 2,950 | 19,302 | 38,544 | |
Owner-Occupied Values | < 100K | 782 | 5173 | 14341 |
100-199K | 471 | 2163 | 5031 | |
200-299K | 686 | 2685 | 6096 | |
300-399K | 60 | 1675 | 4298 | |
400-499K | 56 | 1114 | 3162 | |
500K+ | 50 | 2325 | 7385 | |
Total Working Age Population | 8,595 | 65,361 | 152,568 | |
In Work Force | 5,899 | 41,304 | 92,255 | |
Not In Work Force | 2,696 | 24,057 | 60,313 | |
Workforce Employed | 5,535 | 38,856 | 86,706 | |
Workforce Unemployed | 353 | 2,417 | 5,457 | |
Civlian Workforce | 5,888 | 41,272 | 92,163 | |
Military Workforce | 11 | 32 | 93 | |
Total Households | 5,055 | 34,436 | 78,857 | |
Family Households | 2,276 | 15,821 | 40,933 | |
Non-Family Households | 2,779 | 18,615 | 37,924 | |
Married Couple | 939 | 9,295 | 25,365 | |
Other Family | 1,337 | 6,526 | 15,569 | |
Married w/Child | 277 | 3,685 | 9,548 | |
Single Male w/Child | 74 | 484 | 1,023 | |
Single Female w/Child | 591 | 2,424 | 5,834 |
Population Change Last Two Decades - Plus Projection
2000 | % | 2010 | % | 2020 | % | 2030 | |
---|---|---|---|---|---|---|---|
Alabama | 4,447,100 | +7 | 4,779,736 | +3 | 4,940,253 | +4 | 5,124,380 |
Jefferson County | 662,047 | -1 | 658,466 | +1 | 662,458 | 0 | 665,244 |
Total Working Age Population:
Total Households:
Total Working Age Population:
Total Households:
Total Working Age Population:
Total Households: