Commercial Land
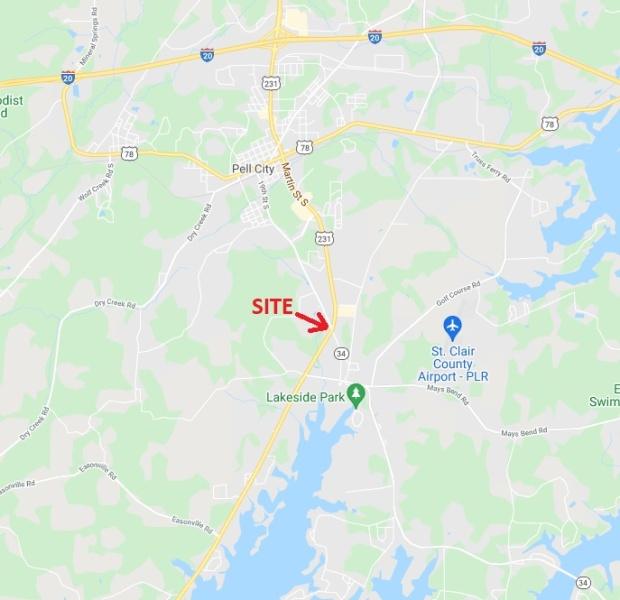
2323 19th Street South Pell City, AL 35128
2323 19th Street South Pell City, AL 35128
Details & Description
Property Highlights
- • Zoning: B-2 General Business District
- • Includes vacant home
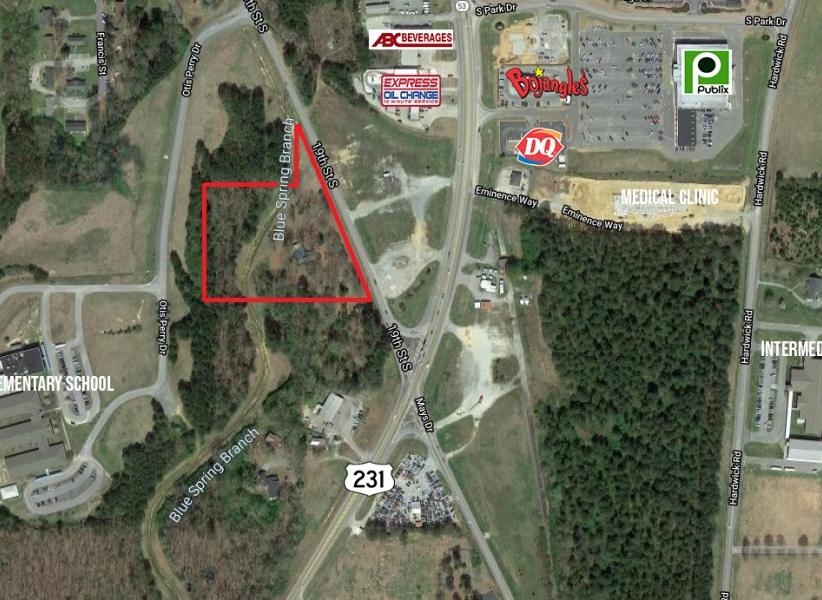
- • Near Publix Shopping Center in a high-growth area
Listing Agents

Austin Blair
O: 205-478-7805
ablair@lahcommercial.com
O: 205-478-7805
ablair@lahcommercial.com
While we strive to provide the most accurate information, all listing information, and demographic data, is provided by third-parties. As such, MyEListing will not be responsible for the accuracy of the information. It is strongly recommended that you verify all information with the listing agent, and any relevant agencies, prior to making any decisions.