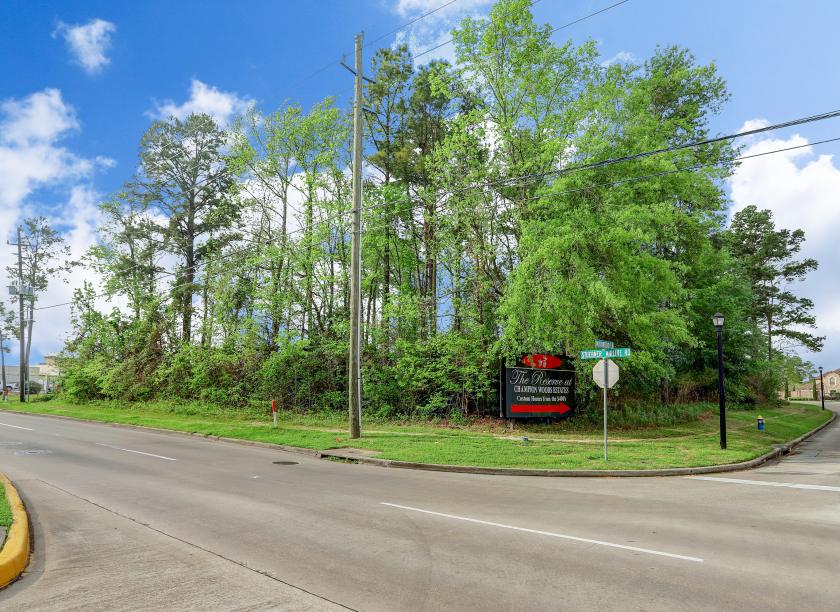
1-Mile | 3-Miles | 5-Miles | ||
---|---|---|---|---|
Total Population | 13,653 | 94,470 | 281,160 | |
Population Median Age | 37 | 38 | 36 | |
Population by Age | 0-9 Yrs | 2130 (15%) | 12679 (13%) | 42047 (14%) |
10-19 Yrs | 2071 (15%) | 13859 (14%) | 41982 (14%) | |
20-29 Yrs | 1311 (9%) | 10058 (10%) | 34339 (12%) | |
30-39 Yrs | 2110 (15%) | 12787 (13%) | 42993 (15%) | |
40-49 Yrs | 1621 (11%) | 12540 (13%) | 37875 (13%) | |
50-59 Yrs | 1607 (11%) | 12766 (13%) | 33493 (11%) | |
60-69 Yrs | 1631 (11%) | 11384 (12%) | 27066 (9%) | |
70+ Yrs | 1173 (8%) | 8397 (8%) | 21365 (7%) | |
Median HH Income | $80,230 | $90,666 | $79,858 | |
Total Household Income | < 24K | 486 (10%) | 3160 (9%) | 10841 (11%) |
25-49K | 792 (17%) | 5142 (15%) | 17404 (18%) | |
50-74K | 871 (19%) | 5560 (16%) | 17443 (18%) | |
75-99K | 594 (13%) | 4611 (13%) | 13131 (13%) | |
100-199K | 1194 (26%) | 9832 (29%) | 26726 (27%) | |
200K+ | 609 (13%) | 5198 (15%) | 10935 (11%) | |
Highest Education Level | No Diploma | 578 | 3551 | 17066 |
Diploma or GED | 1791 | 11082 | 35813 | |
Some College | 1875 | 13601 | 40690 | |
Assoc. Degree | 787 | 5924 | 15869 | |
Bachelors Degree | 2214 | 19431 | 49719 | |
Higher Degree | 1399 | 9557 | 22385 | |
Total Housing Units | 4,906 | 35,637 | 102,641 | |
--Owner-Occupied | 2,891 | 23,698 | 63,153 | |
--Renter-Occupied | 1,656 | 9,804 | 33,327 | |
Owner-Occupied Values | < 100K | 84 | 1091 | 3804 |
100-199K | 904 | 6022 | 21416 | |
200-299K | 929 | 8707 | 22960 | |
300-399K | 566 | 4611 | 8842 | |
400-499K | 223 | 1657 | 3193 | |
500K+ | 185 | 1610 | 2937 | |
Total Working Age Population | 10,058 | 73,430 | 213,210 | |
In Work Force | 6,748 | 48,807 | 146,584 | |
Not In Work Force | 3,310 | 24,623 | 66,626 | |
Workforce Employed | 6,260 | 45,493 | 137,630 | |
Workforce Unemployed | 479 | 3,271 | 8,809 | |
Civlian Workforce | 6,739 | 48,764 | 146,439 | |
Military Workforce | 9 | 42 | 145 | |
Total Households | 4,547 | 33,503 | 96,479 | |
Family Households | 3,596 | 25,321 | 70,847 | |
Non-Family Households | 951 | 8,182 | 25,633 | |
Married Couple | 2,625 | 19,882 | 53,212 | |
Other Family | 971 | 5,439 | 17,635 | |
Married w/Child | 1,107 | 8,308 | 24,632 | |
Single Male w/Child | 296 | 647 | 2,157 | |
Single Female w/Child | 308 | 1,810 | 7,619 |
Population Change Last Two Decades - Plus Projection
2000 | % | 2010 | % | 2020 | % | 2030 | |
---|---|---|---|---|---|---|---|
Texas | 20,851,820 | +21 | 25,145,561 | +18 | 29,677,668 | +18 | 34,894,452 |
Harris County | 3,400,578 | +20 | 4,092,459 | +22 | 4,978,845 | +19 | 5,924,750 |
Total Working Age Population:
Total Households:
Total Working Age Population:
Total Households:
Total Working Age Population:
Total Households: