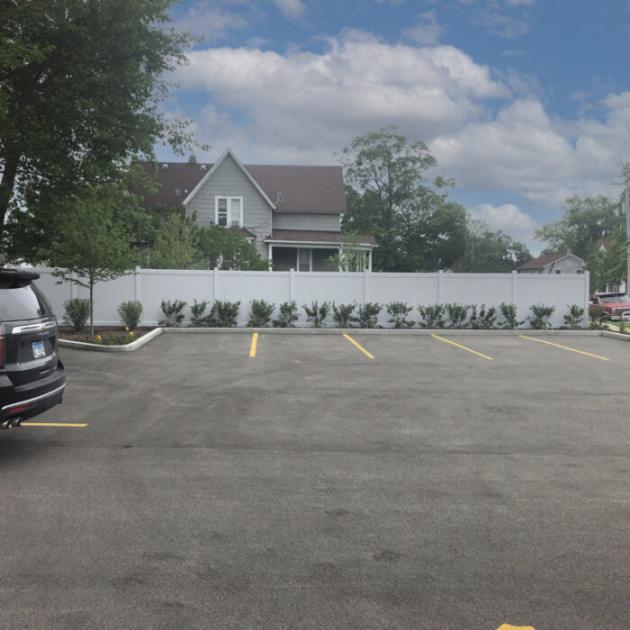
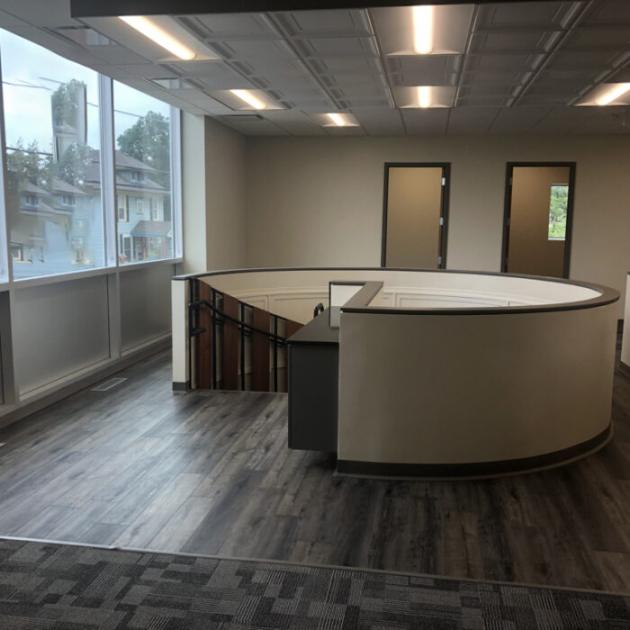
Office Space
721 Dundee Avenue Elgin, IL 60120
721 Dundee Avenue Elgin, IL 60120

Details & Description
Property Highlights
- • Year Built 1958
- • HVAC System GFA / Central Air
- • Electrical 200 AMP
- • Sprinklers No / Alarm Monitored
- • Washrooms 4 (common)
- • Ceiling Height 9 FT
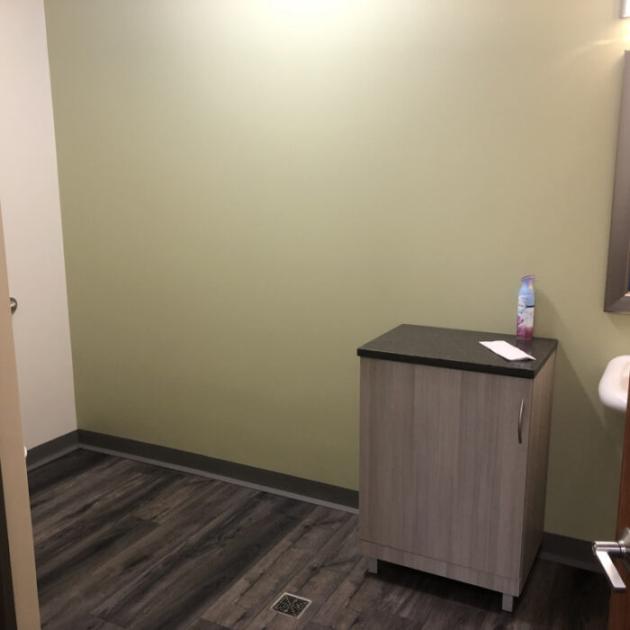
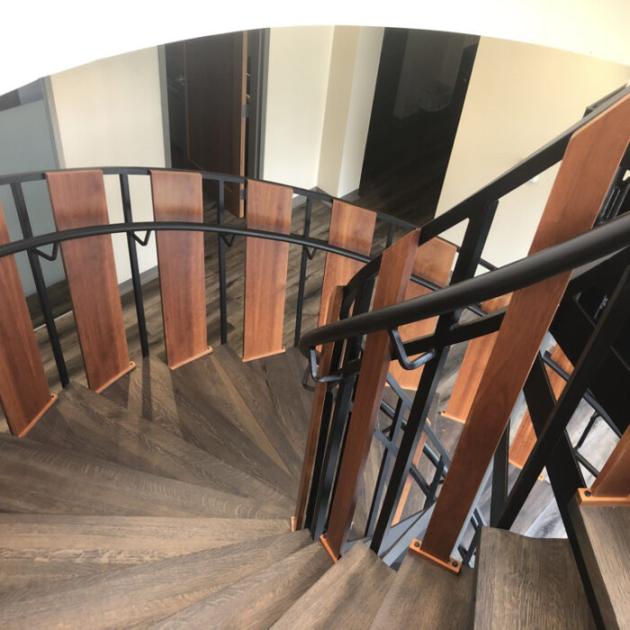
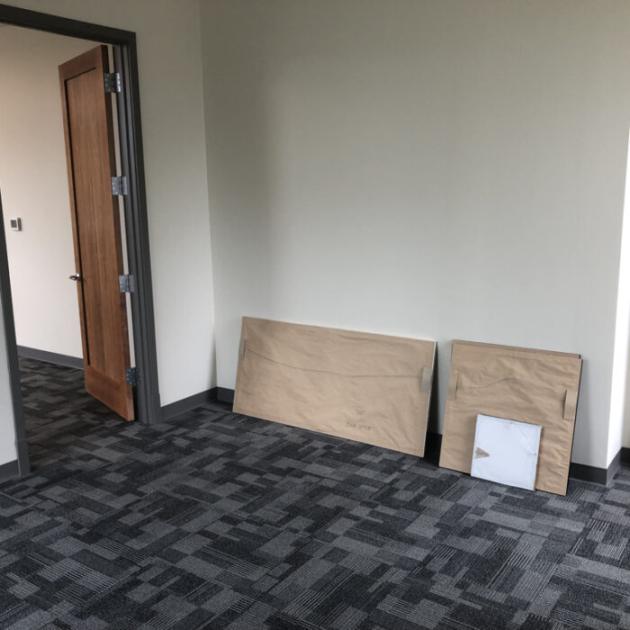
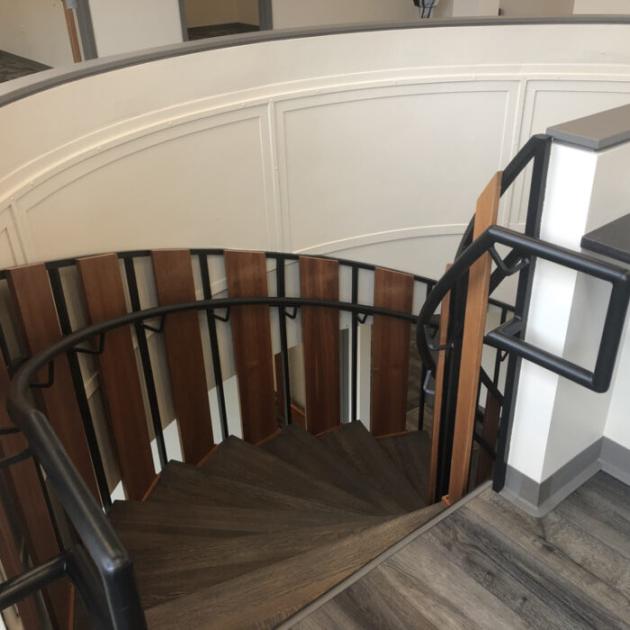
Additional Photos


Listing Agents

Sharon Glasshof
M: 847-533-6974
sharong@premiercommercialrealty.com
M: 847-533-6974
sharong@premiercommercialrealty.com
While we strive to provide the most accurate information, all listing information, and demographic data, is provided by third-parties. As such, MyEListing will not be responsible for the accuracy of the information. It is strongly recommended that you verify all information with the listing agent, and any relevant agencies, prior to making any decisions.