Retail Space
650 East Terra Cotta Avenue Crystal Lake, IL 60014
650 East Terra Cotta Avenue Crystal Lake, IL 60014

Details & Description
Property Highlights
- • Year Built 2005
- • HVAC System GFA / Central Air
- • Electrical 200 amp
- • Sprinklers Yes
- • Washrooms Varies per Unit
- • Ceiling Height 12’
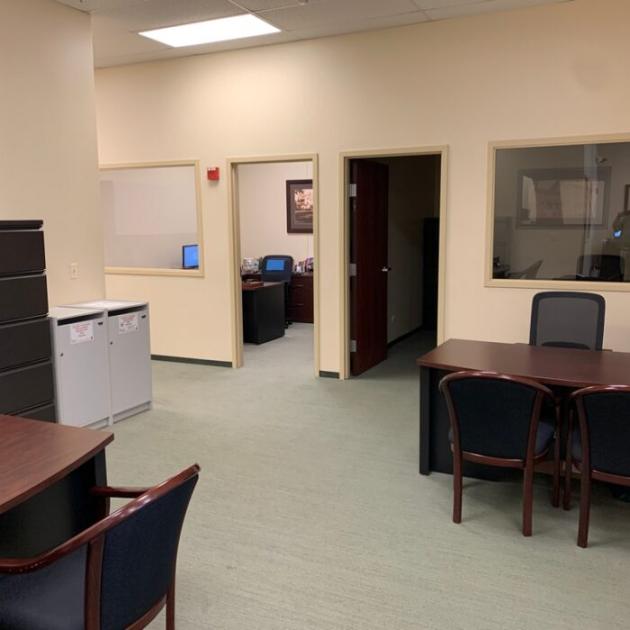
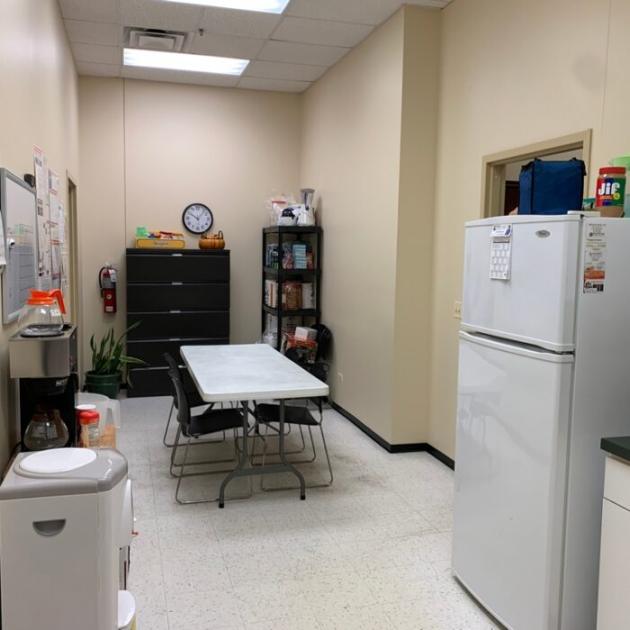
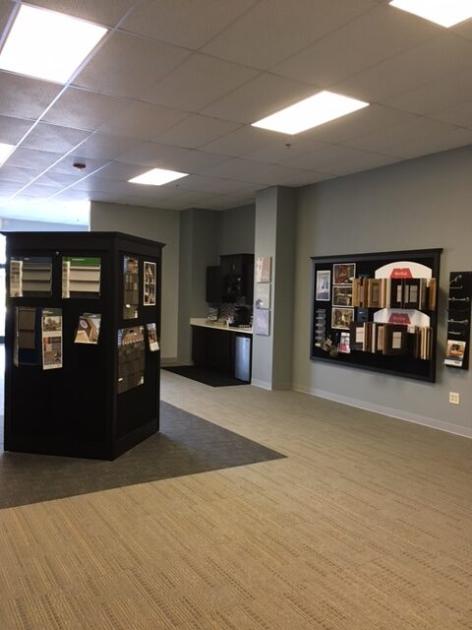
Additional Photos


Listing Agents

Heather Schweitzer
O: 847-854-2300
M: 815-236-9816
heathers@premiercommercialrealty.com
O: 847-854-2300
M: 815-236-9816
heathers@premiercommercialrealty.com

Mike Deacon
O: 847-854-2300
M: 815-814-6500
michaeld@premiercommercialrealty.com
O: 847-854-2300
M: 815-814-6500
michaeld@premiercommercialrealty.com
While we strive to provide the most accurate information, all listing information, and demographic data, is provided by third-parties. As such, MyEListing will not be responsible for the accuracy of the information. It is strongly recommended that you verify all information with the listing agent, and any relevant agencies, prior to making any decisions.