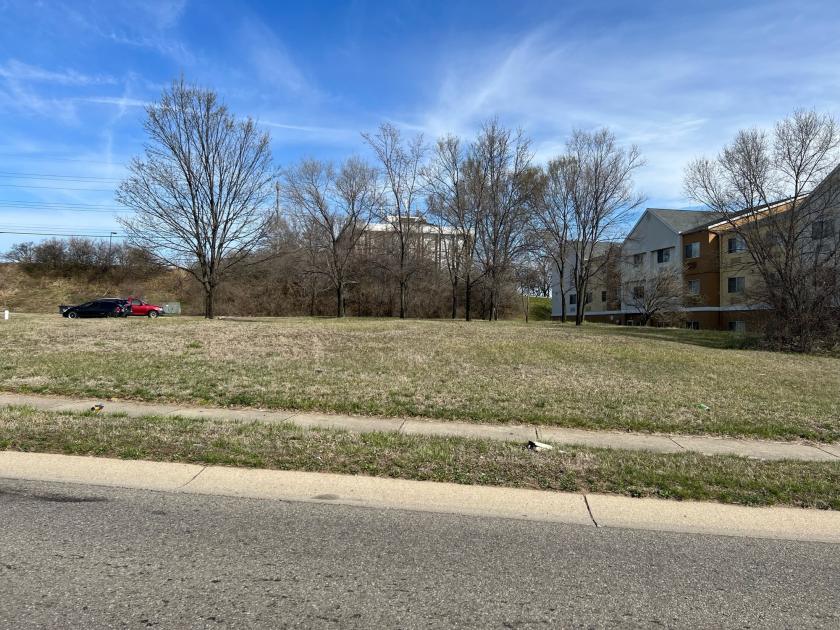
Commercial Land
6780 Roosevelt Avenue Middletown, OH 45005
6780 Roosevelt Avenue Middletown, OH 45005

Details & Description
Property Highlights
- • $250,000
- • 0.7249 Acres
- • B1 zoning
- • Close to I75
- • Ideal for many users
- • Easement for access via adjacent lot
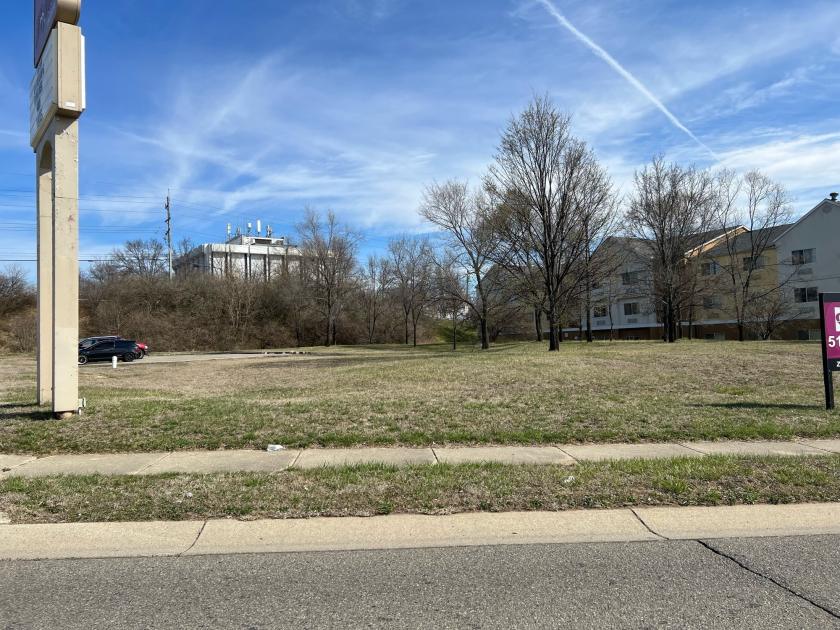
Additional Photos

Listing Agents

Russ Maas
O: 937-554-9099
M: 937-554-9099
russ@bergmancommercial.com
O: 937-554-9099
M: 937-554-9099
russ@bergmancommercial.com
While we strive to provide the most accurate information, all listing information, and demographic data, is provided by third-parties. As such, MyEListing will not be responsible for the accuracy of the information. It is strongly recommended that you verify all information with the listing agent, and any relevant agencies, prior to making any decisions.


