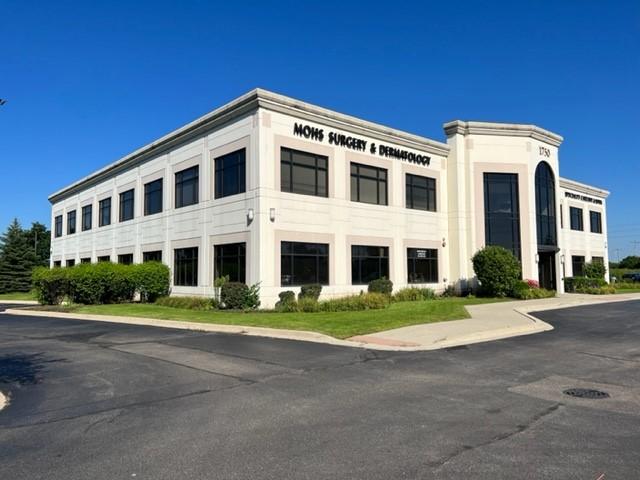
Office Space
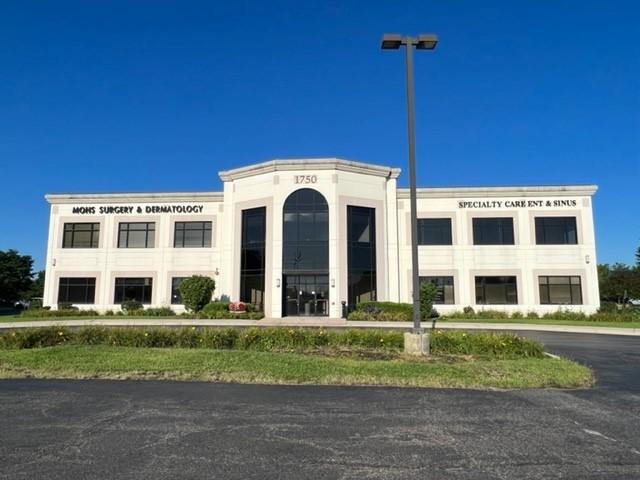
1750 North Randall Road Elgin, IL 60123
1750 North Randall Road Elgin, IL 60123

Details & Description
Property Highlights
- • Year Built 2006
- • HVAC System GFA / Central Air
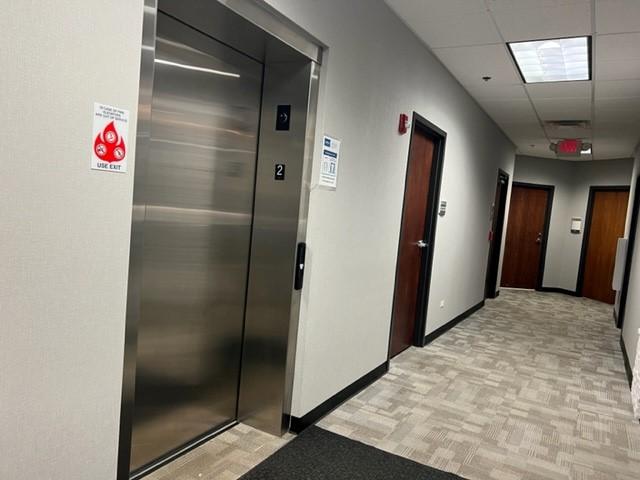
- • Elevator Yes
- • Sprinklers Yes
- • Ceiling Height 9’
- • Parking 160 spaces Common
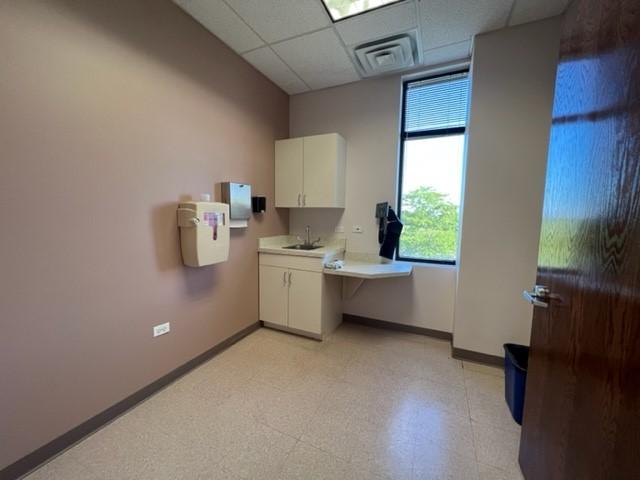
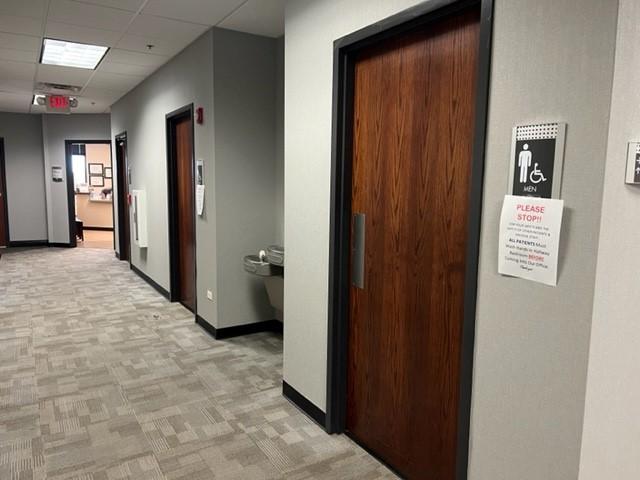
Additional Photos


Listing Agents

Heather Schweitzer
O: 847-854-2300
M: 815-236-9816
heathers@premiercommercialrealty.com
O: 847-854-2300
M: 815-236-9816
heathers@premiercommercialrealty.com
While we strive to provide the most accurate information, all listing information, and demographic data, is provided by third-parties. As such, MyEListing will not be responsible for the accuracy of the information. It is strongly recommended that you verify all information with the listing agent, and any relevant agencies, prior to making any decisions.