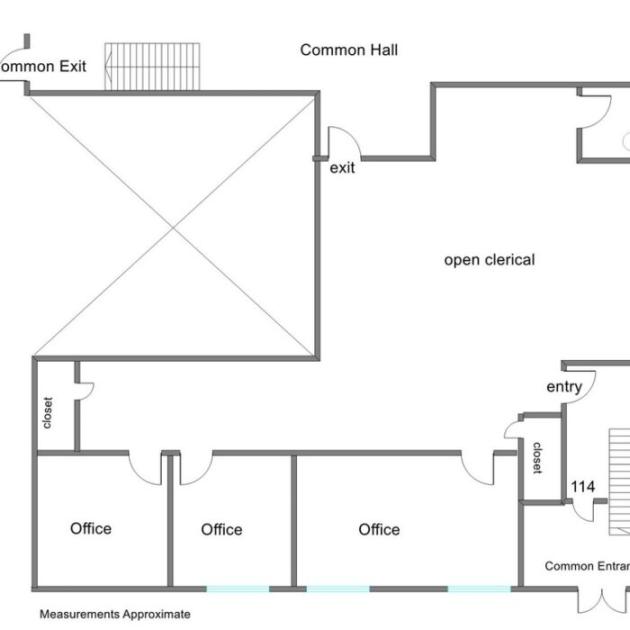
Office Space
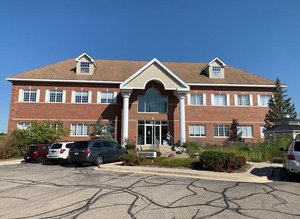
114 West Calhoun Street Woodstock, IL 60098
114 West Calhoun Street Woodstock, IL 60098

Details & Description
Property Highlights
- • Year Built 1940 / 1998
- • HVAC System GFA / Central Air
- • Electrical 100 AMP
- • Sprinklers No
- • Washrooms 1
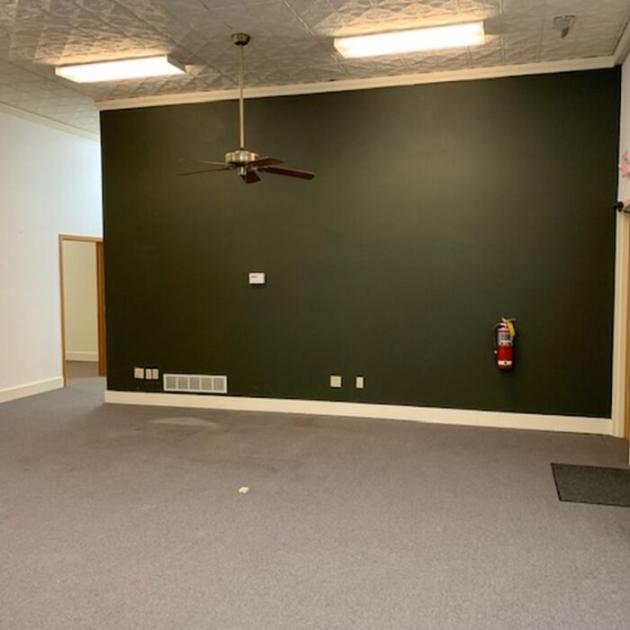
- • Ceiling Height 12 FT
Additional Photos


Listing Agents

Mike Deacon
O: 847-854-2300
M: 815-814-6500
michaeld@premiercommercialrealty.com
O: 847-854-2300
M: 815-814-6500
michaeld@premiercommercialrealty.com
While we strive to provide the most accurate information, all listing information, and demographic data, is provided by third-parties. As such, MyEListing will not be responsible for the accuracy of the information. It is strongly recommended that you verify all information with the listing agent, and any relevant agencies, prior to making any decisions.