Retail Space
1055 Nimco Drive Crystal Lake, IL 60014
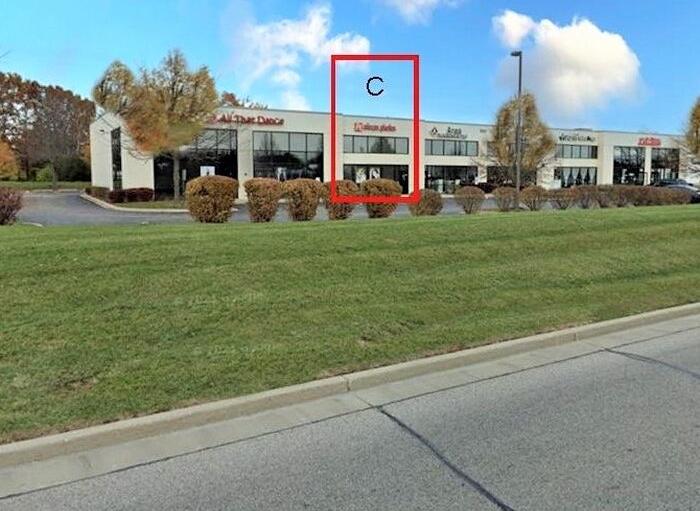
1055 Nimco Drive Crystal Lake, IL 60014
Details & Description
Property Highlights
- • Year Built 2004
- • HVAC System 4 Ton Rooftop / Central Air
- • Electric 200 Amp 3-Phase
- • Washrooms 1 ADA
- • Ceiling Height 20’
- • Drive In Door 1 10x12
Additional Photos


Listing Agents

Kevin Kaplan
O: 847-854-2300
M: 309-261-0920
kevink@premiercommercialrealty.com
O: 847-854-2300
M: 309-261-0920
kevink@premiercommercialrealty.com

Bruce Kaplan
O: 847-854-2300
M: 847-507-1759
brucek@premiercommercialrealty.com
O: 847-854-2300
M: 847-507-1759
brucek@premiercommercialrealty.com
While we strive to provide the most accurate information, all listing information, and demographic data, is provided by third-parties. As such, MyEListing will not be responsible for the accuracy of the information. It is strongly recommended that you verify all information with the listing agent, and any relevant agencies, prior to making any decisions.


