Office Space
805 Lake Avenue Woodstock, IL 60098
805 Lake Avenue Woodstock, IL 60098

Details & Description
Property Highlights
- • Year Built 1930 w/ Updates
- • Electrical 100 amp
- • Sprinkled No
- • Parking Private lots
- • Sewer/Water City
- • Zoning B1
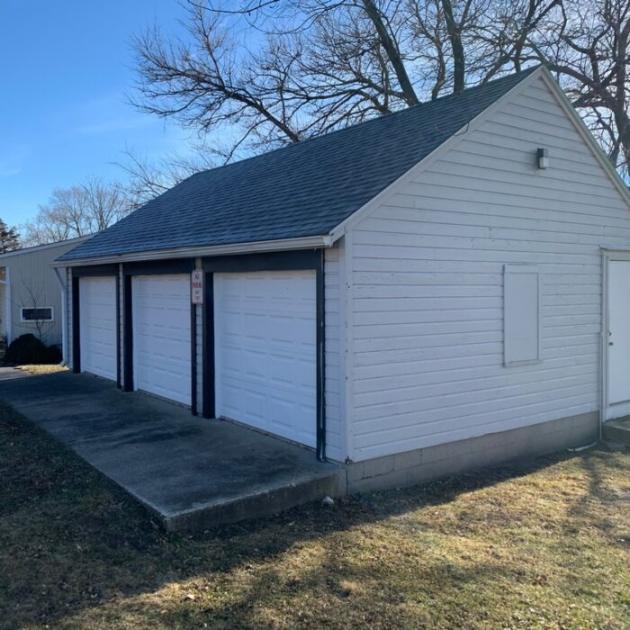
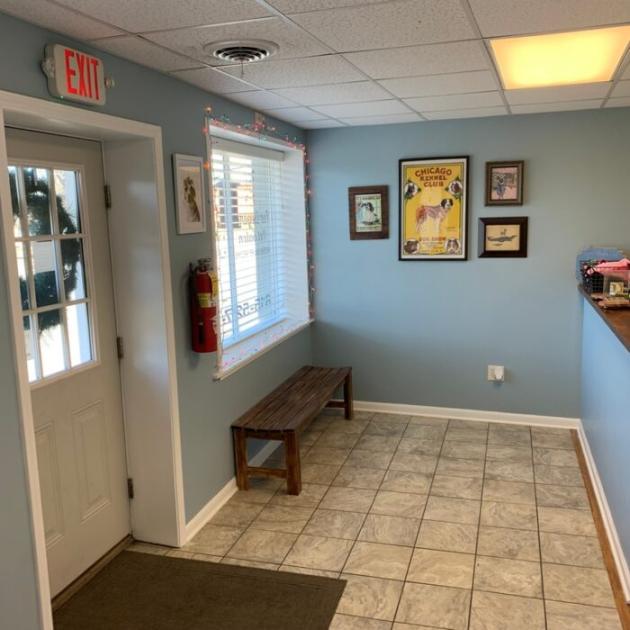
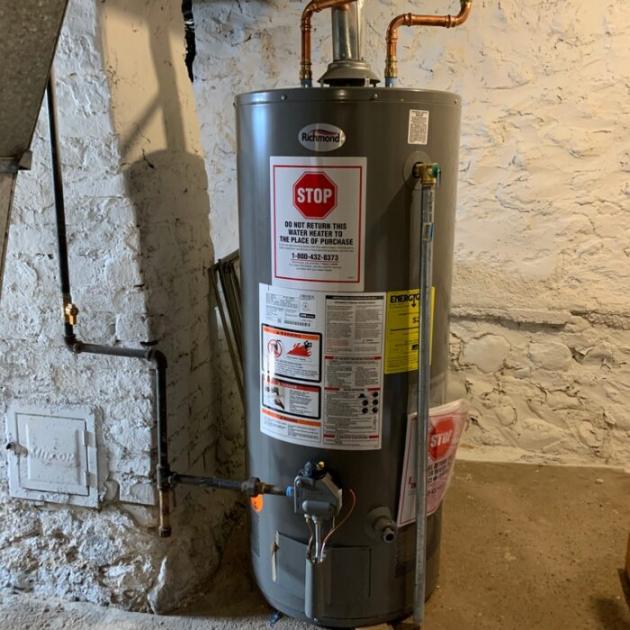
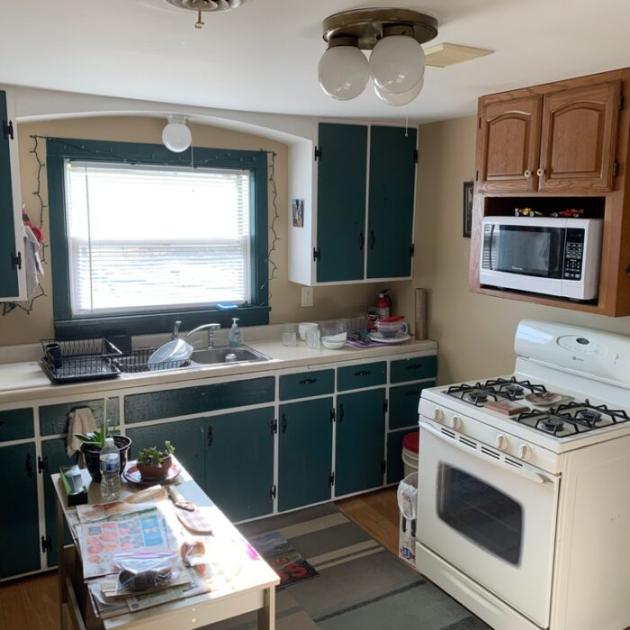
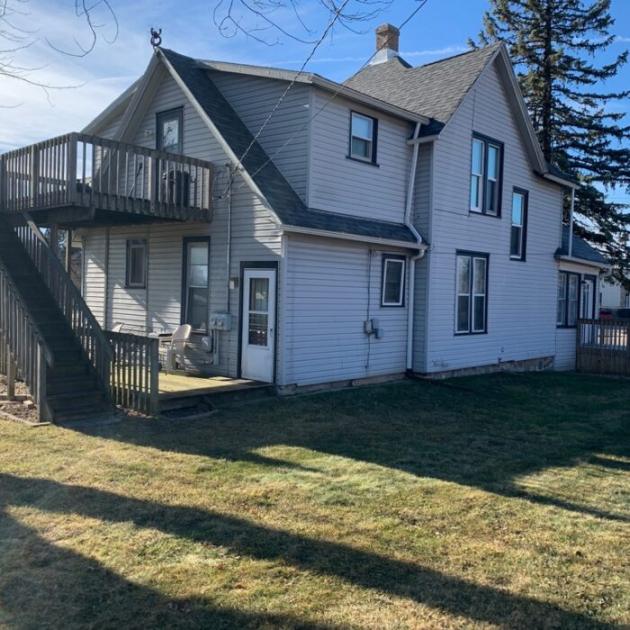
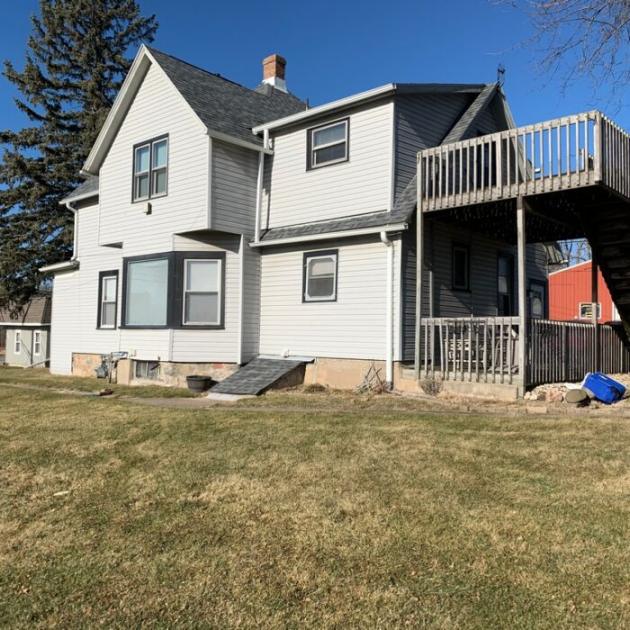
Additional Photos


Listing Agents

Kevin Kaplan
O: 847-854-2300
M: 309-261-0920
kevink@premiercommercialrealty.com
O: 847-854-2300
M: 309-261-0920
kevink@premiercommercialrealty.com
While we strive to provide the most accurate information, all listing information, and demographic data, is provided by third-parties. As such, MyEListing will not be responsible for the accuracy of the information. It is strongly recommended that you verify all information with the listing agent, and any relevant agencies, prior to making any decisions.