Industrial Properties
6704 Pingree Road Crystal Lake, IL 60014
6704 Pingree Road Crystal Lake, IL 60014
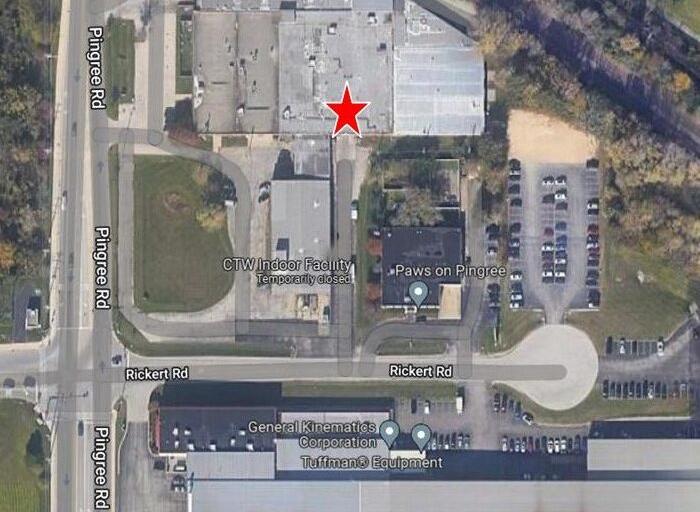
Details & Description
Property Highlights
- • Year Built 1957
- • Office Potential
- • HVAC System GFA - ceiling units
- • Electrical 2000 amp, 480V, 3 phase
- • Sprinklers Yes Double Capacity
- • Washrooms 1
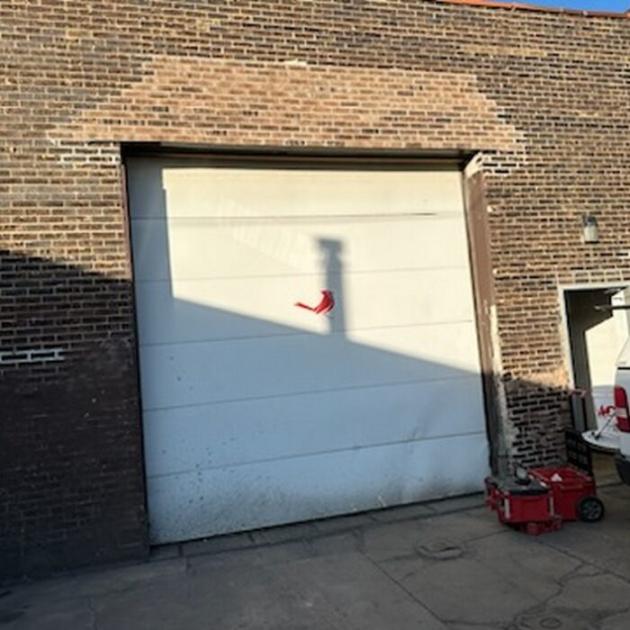
Additional Photos


Listing Agents

Bruce Kaplan
O: 847-854-2300
M: 847-507-1759
brucek@premiercommercialrealty.com
O: 847-854-2300
M: 847-507-1759
brucek@premiercommercialrealty.com

Kevin Kaplan
O: 847-854-2300
M: 309-261-0920
kevink@premiercommercialrealty.com
O: 847-854-2300
M: 309-261-0920
kevink@premiercommercialrealty.com
While we strive to provide the most accurate information, all listing information, and demographic data, is provided by third-parties. As such, MyEListing will not be responsible for the accuracy of the information. It is strongly recommended that you verify all information with the listing agent, and any relevant agencies, prior to making any decisions.


