Industrial Properties
12815 South Zarzamora Street San Antonio, TX 78224
12815 South Zarzamora Street San Antonio, TX 78224
Details & Description
Property Highlights
• 2.5 miles to Loop 410, 7 miles to I-35, and 12.5 miles to Downtown
• Current tenants include UPS, Penske, and Ram Tools
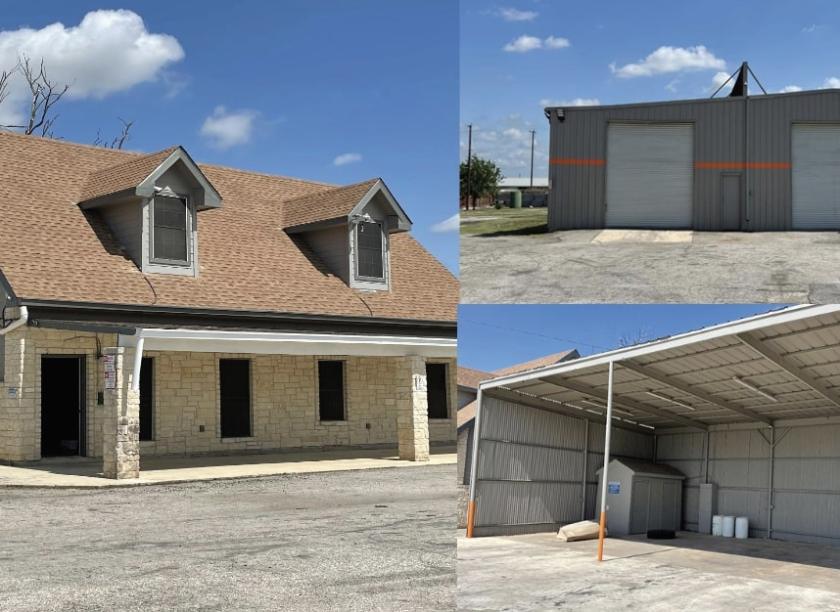
Additional Photos


Listing Agents

Brittney Dale
O: 210-222-2424
M: 210-587-9078
brittney.dale@dhrp.us
O: 210-222-2424
M: 210-587-9078
brittney.dale@dhrp.us
While we strive to provide the most accurate information, all listing information, and demographic data, is provided by third-parties. As such, MyEListing will not be responsible for the accuracy of the information. It is strongly recommended that you verify all information with the listing agent, and any relevant agencies, prior to making any decisions.


