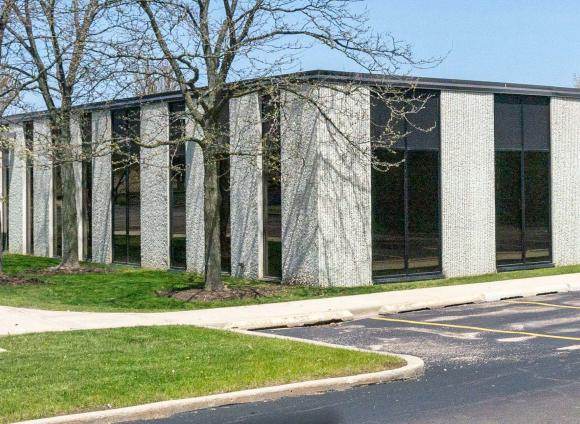
Office Space
2775 Shermer Road Northbrook, IL 60062
2775 Shermer Road Northbrook, IL 60062
Details & Description
Property Highlights
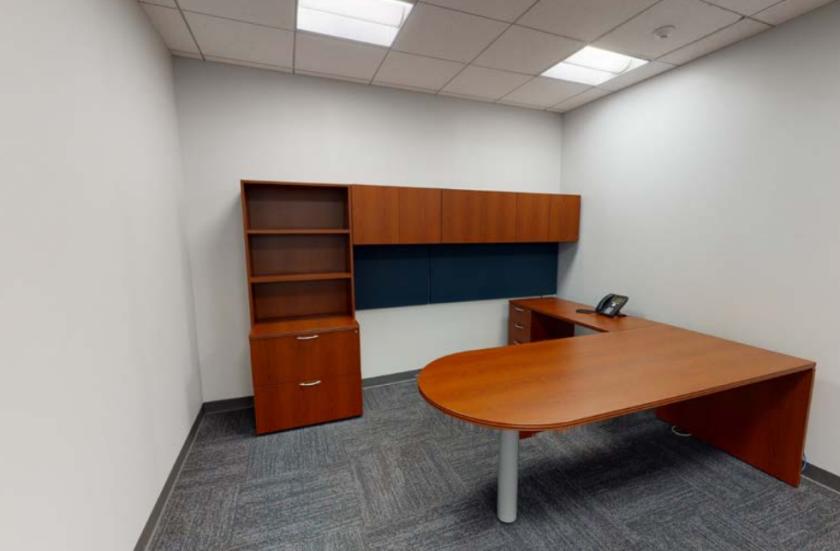
- • FULLY FURNISHED SPEC SUITE IN NORTHBROOK
- • Space divisible to 19,623 RSF
- • 7/1,000 parking ratio
Additional Photos


Listing Agents

Chris Cummins
O: 773-458-1352
chris.cummins@jll.com
O: 773-458-1352
chris.cummins@jll.com
While we strive to provide the most accurate information, all listing information, and demographic data, is provided by third-parties. As such, MyEListing will not be responsible for the accuracy of the information. It is strongly recommended that you verify all information with the listing agent, and any relevant agencies, prior to making any decisions.


