Office Space
275 North Field Drive Lake Forest, IL 60045
275 North Field Drive Lake Forest, IL 60045

Details & Description
Property Highlights
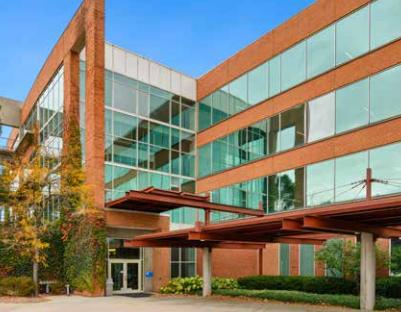
- • A modern, innovative office destination
- • Class A office building in Lake Forest
- • 10,000 SF conference facilities
- • Fitness Center with showers and yoga room
- • Full service cafeteria with seating
- • Coffee bar with collaborative space
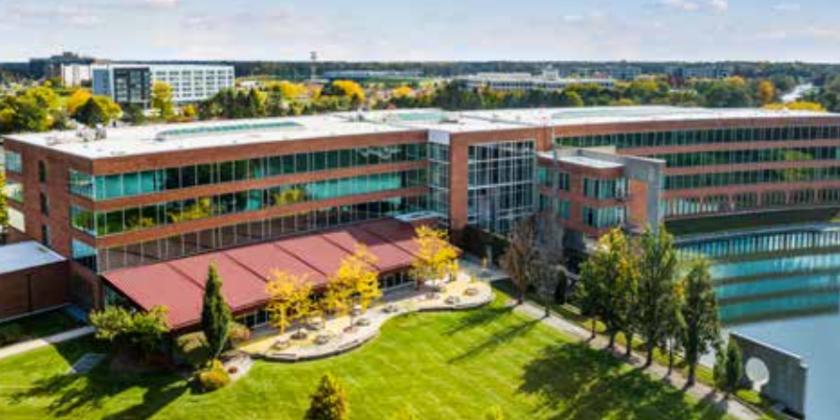
Additional Photos


Listing Agents

Chris Cummins
O: 773-458-1352
chris.cummins@jll.com
O: 773-458-1352
chris.cummins@jll.com
While we strive to provide the most accurate information, all listing information, and demographic data, is provided by third-parties. As such, MyEListing will not be responsible for the accuracy of the information. It is strongly recommended that you verify all information with the listing agent, and any relevant agencies, prior to making any decisions.


