Office Space
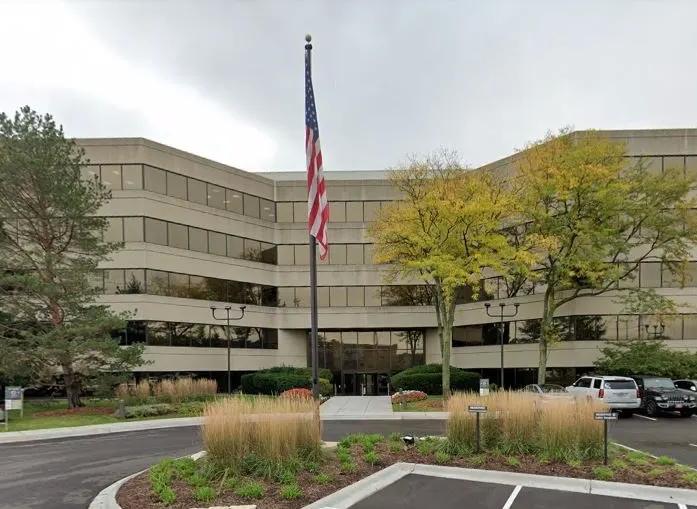
5 Revere Drive Northbrook, IL 60062
5 Revere Drive Northbrook, IL 60062
Details & Description
Property Highlights
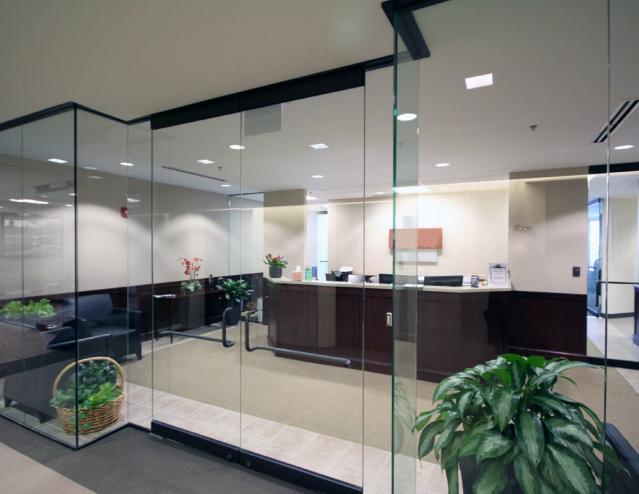
- • Recently renovated lobby, corridors, and restrooms
- • Underground and reserved parking
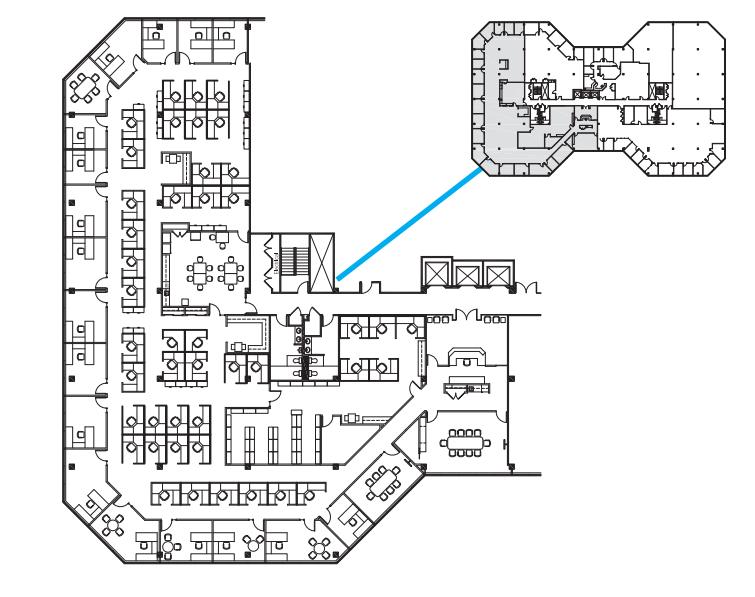
- • Expansive window lines and large floorplates
- • Monument signage available
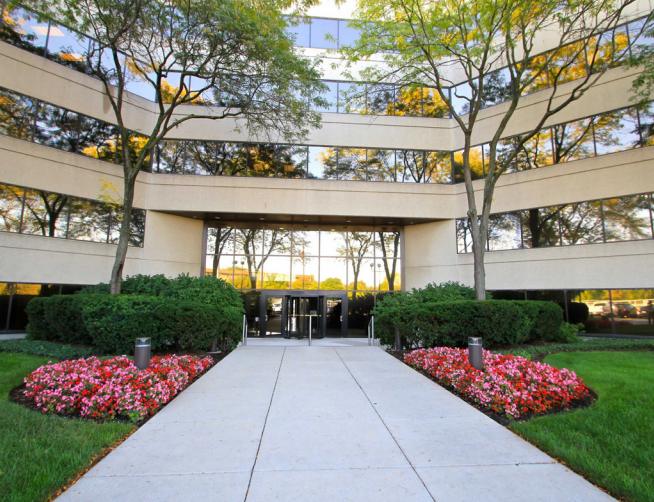
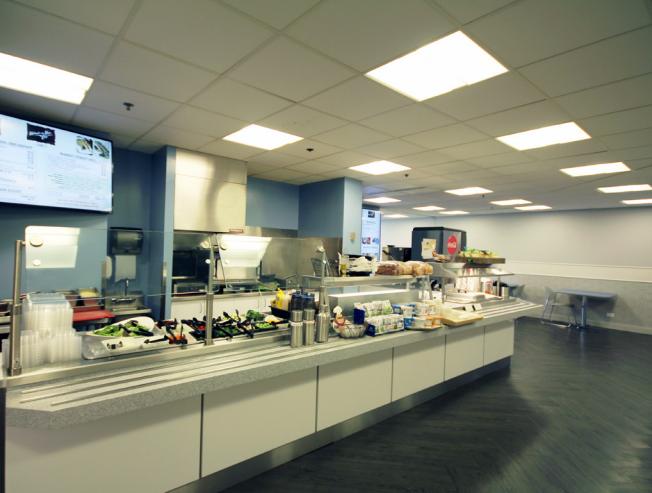
Additional Photos
Listing Agents

Doug Shehan
O: 773-458-1382
doug.shehan@jll.com
O: 773-458-1382
doug.shehan@jll.com
While we strive to provide the most accurate information, all listing information, and demographic data, is provided by third-parties. As such, MyEListing will not be responsible for the accuracy of the information. It is strongly recommended that you verify all information with the listing agent, and any relevant agencies, prior to making any decisions.


