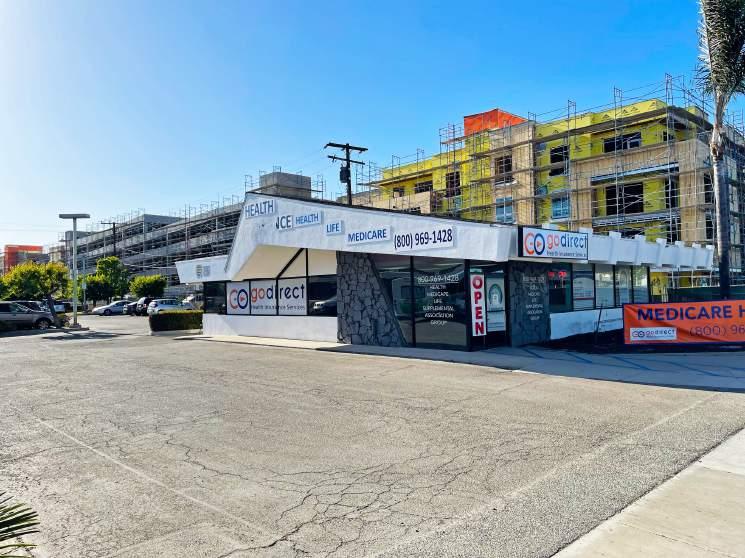
1-Mile | 3-Miles | 5-Miles | ||
---|---|---|---|---|
Total Population | 34,196 | 174,599 | 402,857 | |
Population Median Age | 36 | 39 | 40 | |
Population by Age | 0-9 Yrs | 3848 (11%) | 17716 (10%) | 37763 (9%) |
10-19 Yrs | 4282 (12%) | 20410 (11%) | 47873 (11%) | |
20-29 Yrs | 6493 (18%) | 26972 (15%) | 63361 (15%) | |
30-39 Yrs | 5624 (16%) | 25884 (14%) | 57033 (14%) | |
40-49 Yrs | 5208 (15%) | 24081 (13%) | 52850 (13%) | |
50-59 Yrs | 4172 (12%) | 24420 (13%) | 56170 (13%) | |
60-69 Yrs | 2375 (6%) | 16997 (9%) | 42725 (10%) | |
70+ Yrs | 2193 (6%) | 18118 (10%) | 45082 (11%) | |
Median HH Income | $74,944 | $96,932 | $96,722 | |
Total Household Income | < 24K | 1505 (13%) | 6869 (10%) | 17515 (11%) |
25-49K | 2189 (19%) | 8929 (13%) | 20037 (13%) | |
50-74K | 1876 (16%) | 9047 (13%) | 19685 (13%) | |
75-99K | 1729 (15%) | 8969 (13%) | 19560 (13%) | |
100-199K | 2537 (22%) | 19597 (29%) | 45814 (30%) | |
200K+ | 1297 (11%) | 12018 (18%) | 25857 (17%) | |
Highest Education Level | No Diploma | 5878 | 13254 | 33618 |
Diploma or GED | 4755 | 19365 | 44083 | |
Some College | 4408 | 26615 | 58679 | |
Assoc. Degree | 1332 | 10017 | 21771 | |
Bachelors Degree | 5105 | 37872 | 86144 | |
Higher Degree | 2061 | 18876 | 45331 | |
Total Housing Units | 11,673 | 69,480 | 160,178 | |
--Owner-Occupied | 3,278 | 32,148 | 74,075 | |
--Renter-Occupied | 7,854 | 33,282 | 74,394 | |
Owner-Occupied Values | < 100K | 342 | 1064 | 2584 |
100-199K | 30 | 465 | 1412 | |
200-299K | 25 | 301 | 1462 | |
300-399K | 98 | 594 | 2609 | |
400-499K | 442 | 1599 | 4718 | |
500K+ | 2342 | 28125 | 61290 | |
Total Working Age Population | 27,741 | 144,351 | 338,915 | |
In Work Force | 20,335 | 101,175 | 225,536 | |
Not In Work Force | 7,406 | 43,176 | 113,379 | |
Workforce Employed | 19,372 | 96,734 | 215,573 | |
Workforce Unemployed | 942 | 4,340 | 9,774 | |
Civlian Workforce | 20,314 | 101,074 | 225,347 | |
Military Workforce | 21 | 101 | 189 | |
Total Households | 11,132 | 65,430 | 148,469 | |
Family Households | 6,686 | 39,480 | 90,102 | |
Non-Family Households | 4,446 | 25,950 | 58,367 | |
Married Couple | 4,659 | 30,336 | 69,168 | |
Other Family | 2,027 | 9,144 | 20,934 | |
Married w/Child | 2,238 | 12,841 | 26,365 | |
Single Male w/Child | 366 | 1,372 | 2,785 | |
Single Female w/Child | 539 | 2,497 | 5,327 |
Population Change Last Two Decades - Plus Projection
2000 | % | 2010 | % | 2020 | % | 2030 | |
---|---|---|---|---|---|---|---|
California | 33,871,648 | +10 | 37,253,956 | +9 | 40,467,295 | +8 | 43,631,295 |
Orange County | 2,846,289 | +6 | 3,010,232 | +8 | 3,257,087 | +5 | 3,431,096 |
Total Working Age Population:
Total Households:
Total Working Age Population:
Total Households:
Total Working Age Population:
Total Households: