Commercial Land
410 Brentwood Street High Point, NC 27260
410 Brentwood Street High Point, NC 27260
Details & Description
Property Highlights
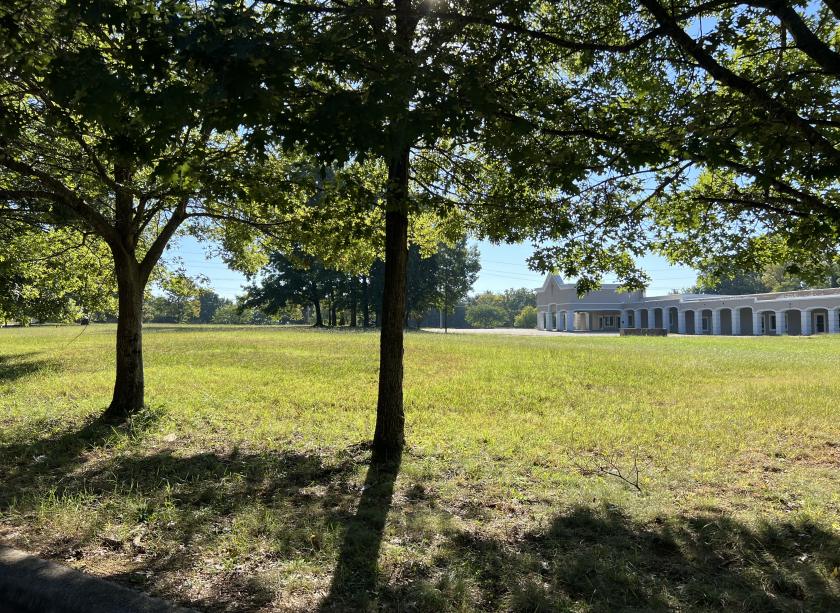
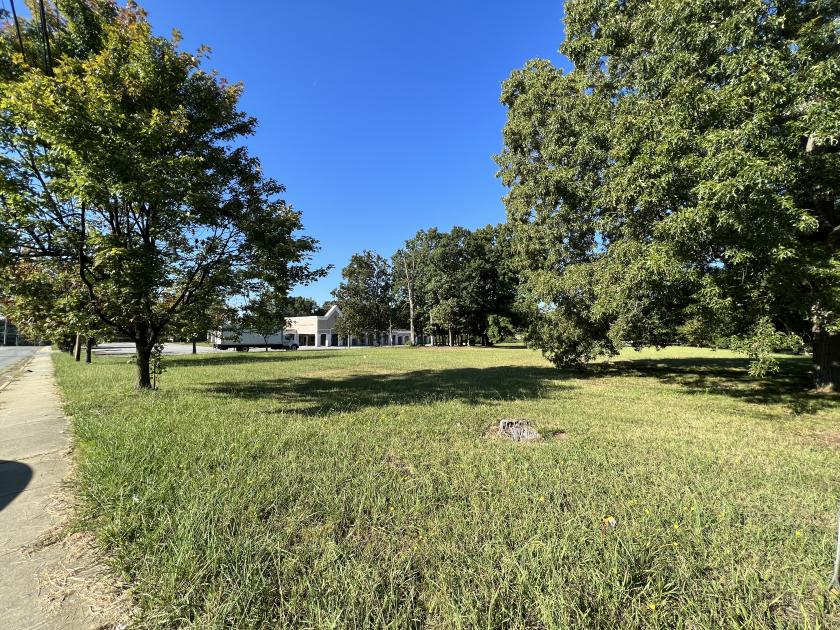
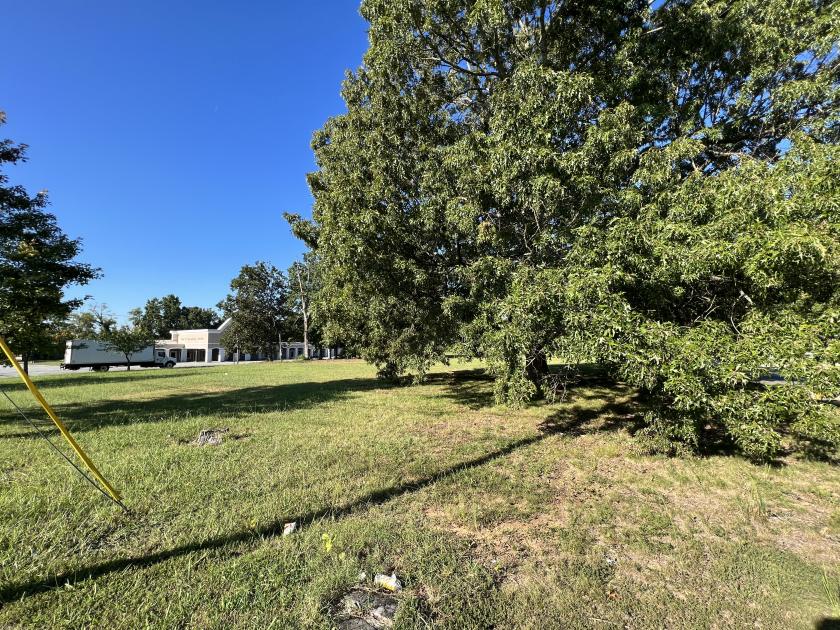
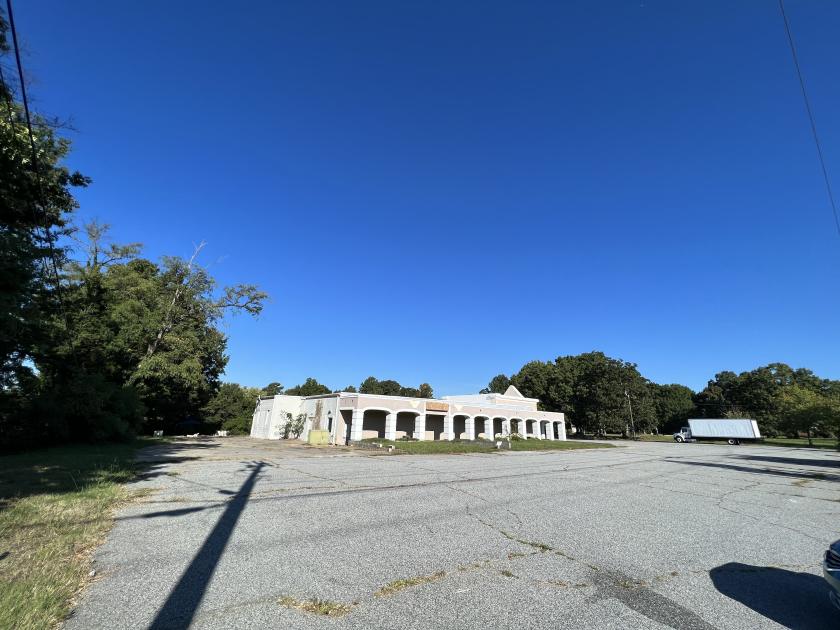
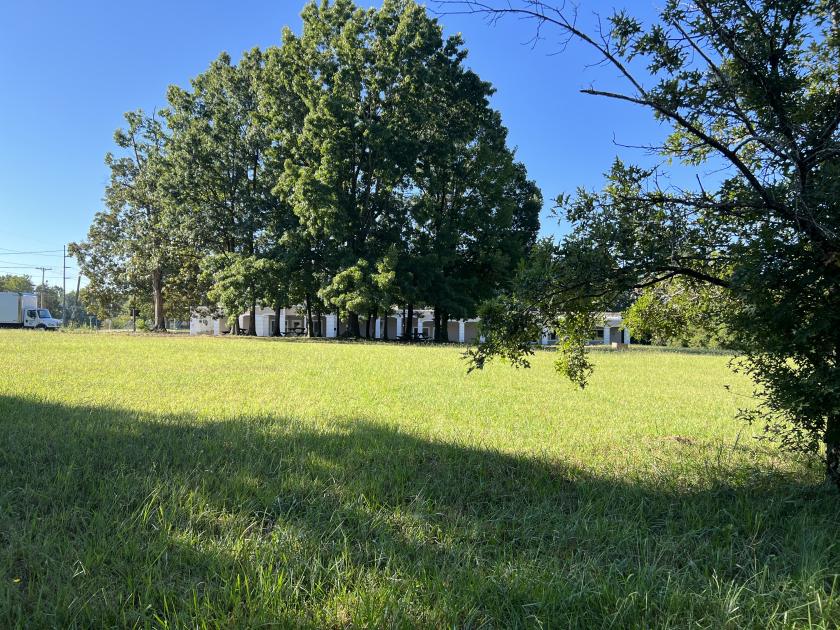
- • +/- 4.66 Acres
- • Redevelopment Opportunity
- • Structure Built in 1974
Additional Photos
Listing Agents

Mark Lindsay
O: 336-878-5171
M: 336-692-5612
LindsayRealEstateHoldings@gmail.com
O: 336-878-5171
M: 336-692-5612
LindsayRealEstateHoldings@gmail.com
While we strive to provide the most accurate information, all listing information, and demographic data, is provided by third-parties. As such, MyEListing will not be responsible for the accuracy of the information. It is strongly recommended that you verify all information with the listing agent, and any relevant agencies, prior to making any decisions.


