Multifamily Housing
124 North Broadway Street Canton, SD 57013
124 North Broadway Street Canton, SD 57013

Details & Description
Property Highlights
- • Year Built 1930
- • Twelve-plex
- • 8 - 1 Bedroom/1 Bathroom
- • 3 - 2 Bedroom/1 Bathroom
- • 1 - 2 Bedroom/2 Bathroom
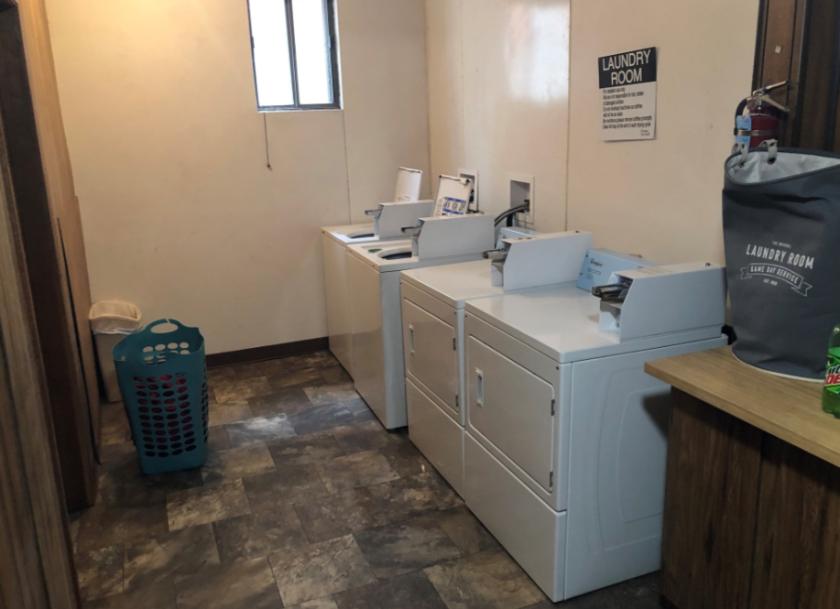
- • Community laundry room
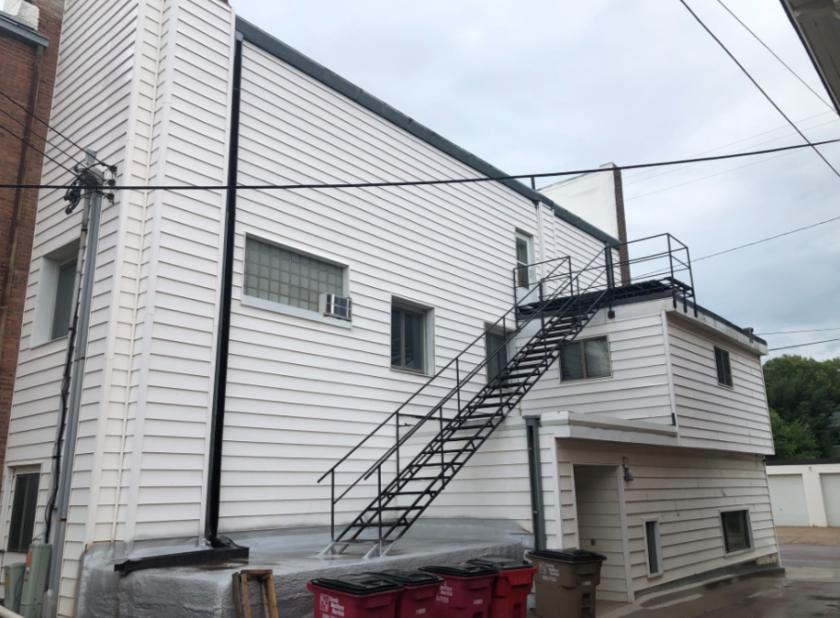
Additional Photos


Listing Agents

Stacey Sieverding
O: 605-357-7100
M: 605-728-1390
ssieverding@naisiouxfalls.com
O: 605-357-7100
M: 605-728-1390
ssieverding@naisiouxfalls.com
While we strive to provide the most accurate information, all listing information, and demographic data, is provided by third-parties. As such, MyEListing will not be responsible for the accuracy of the information. It is strongly recommended that you verify all information with the listing agent, and any relevant agencies, prior to making any decisions.