Commercial Land
Career Place Sioux Falls, SD 57107
Career Place Sioux Falls, SD 57107

Details & Description
Property Highlights
- • $6.00/sq. ft. (including platting fees)
- • Zoning: I-1
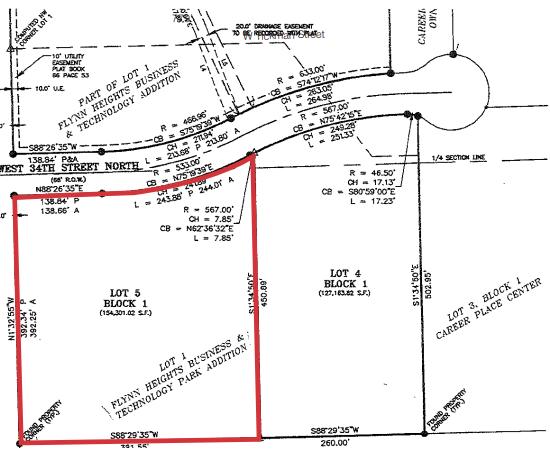
- • Lot 5 Block 1: +/- 3.5 acres
- • May be subdivided, contact broker for details
Listing Agents

Bill Connelly
O: 605-444-7130
M: 605-254-2360
bconnelly@naisiouxfalls.com
O: 605-444-7130
M: 605-254-2360
bconnelly@naisiouxfalls.com
While we strive to provide the most accurate information, all listing information, and demographic data, is provided by third-parties. As such, MyEListing will not be responsible for the accuracy of the information. It is strongly recommended that you verify all information with the listing agent, and any relevant agencies, prior to making any decisions.