Retail Space
2067 Adam Clayton Powell Junior Boulevard New York, NY 10027
2067 Adam Clayton Powell Junior Boulevard New York, NY 10027

Details & Description
Property Highlights
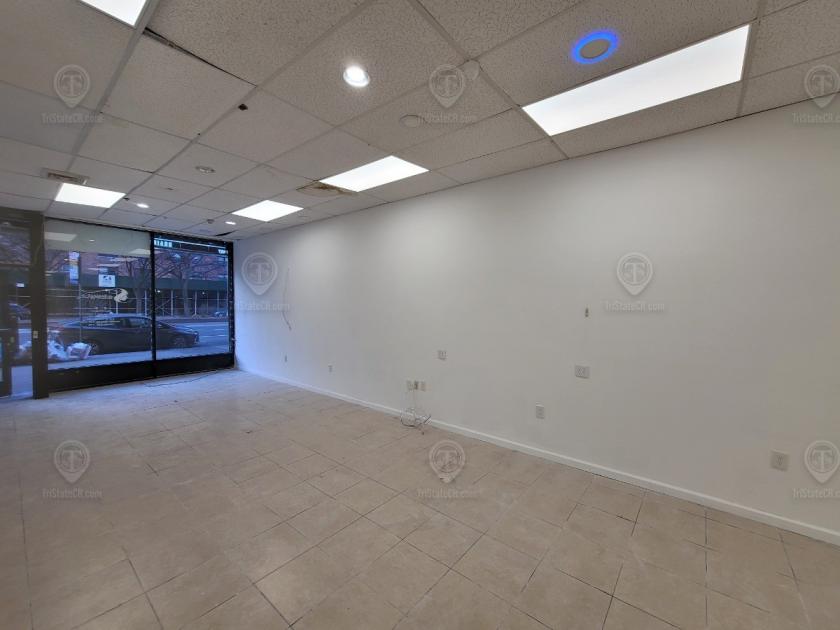
- • Beautifully finished retail space
- • All glass frontage
- • Finished 800 SF basement with internal access
- • Near mass transit and national retailers
Additional Photos


Listing Agents

Shlomi Bagdadi
O: 718-437-6100
info@tristatecr.com
O: 718-437-6100
info@tristatecr.com
While we strive to provide the most accurate information, all listing information, and demographic data, is provided by third-parties. As such, MyEListing will not be responsible for the accuracy of the information. It is strongly recommended that you verify all information with the listing agent, and any relevant agencies, prior to making any decisions.


