Specialty Real Estate
500 6th Avenue Southwest Aberdeen, SD 57401
500 6th Avenue Southwest Aberdeen, SD 57401

Details & Description
Property Highlights
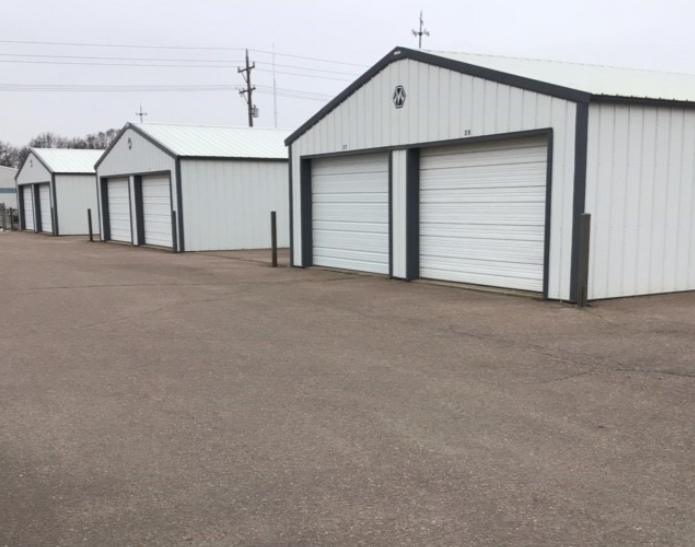
• Paved, on-site parking spots
• Zoning: Commercial
Additional Photos


Listing Agents

Dale Zomer
O: 605-444-7117
M: 605-351-1218
dzomer@naisiouxfalls.com
O: 605-444-7117
M: 605-351-1218
dzomer@naisiouxfalls.com
While we strive to provide the most accurate information, all listing information, and demographic data, is provided by third-parties. As such, MyEListing will not be responsible for the accuracy of the information. It is strongly recommended that you verify all information with the listing agent, and any relevant agencies, prior to making any decisions.


