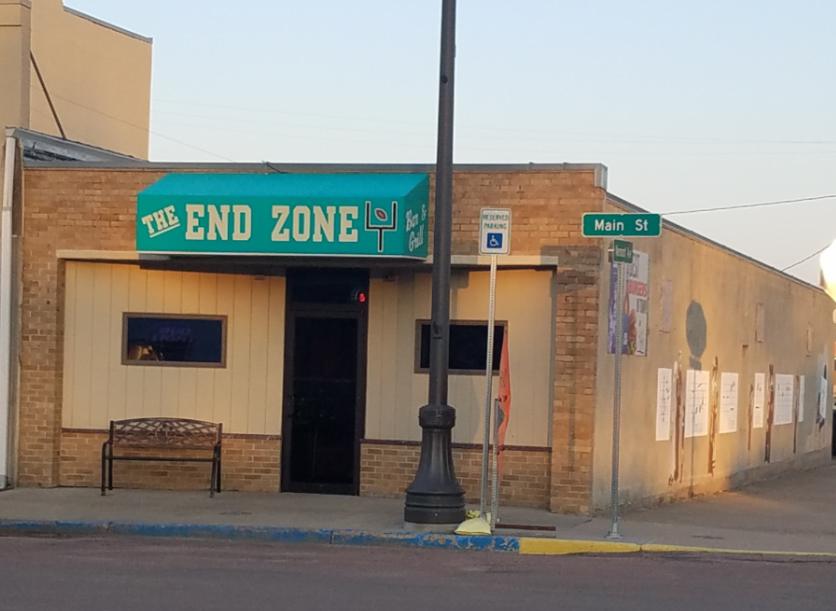
1-Mile | 3-Miles | 5-Miles | ||
---|---|---|---|---|
Total Population | 431 | 1,363 | 1,674 | |
Population Median Age | 43 | 42 | 41 | |
Population by Age | 0-9 Yrs | 60 (13%) | 192 (14%) | 238 (14%) |
10-19 Yrs | 59 (13%) | 188 (13%) | 239 (14%) | |
20-29 Yrs | 32 (7%) | 103 (7%) | 132 (7%) | |
30-39 Yrs | 42 (9%) | 135 (9%) | 173 (10%) | |
40-49 Yrs | 41 (9%) | 133 (9%) | 170 (10%) | |
50-59 Yrs | 51 (11%) | 163 (11%) | 208 (12%) | |
60-69 Yrs | 74 (17%) | 225 (16%) | 255 (15%) | |
70+ Yrs | 73 (16%) | 225 (16%) | 259 (15%) | |
Median HH Income | $60,567 | $61,284 | $63,111 | |
Total Household Income | < 24K | 26 (14%) | 79 (14%) | 92 (13%) |
25-49K | 46 (25%) | 140 (25%) | 160 (24%) | |
50-74K | 39 (22%) | 123 (22%) | 150 (22%) | |
75-99K | 34 (19%) | 109 (19%) | 137 (20%) | |
100-199K | 17 (9%) | 55 (9%) | 72 (10%) | |
200K+ | 15 (8%) | 46 (8%) | 52 (7%) | |
Highest Education Level | No Diploma | 36 | 115 | 136 |
Diploma or GED | 115 | 359 | 429 | |
Some College | 52 | 163 | 198 | |
Assoc. Degree | 33 | 105 | 131 | |
Bachelors Degree | 40 | 125 | 149 | |
Higher Degree | 18 | 59 | 79 | |
Total Housing Units | 212 | 657 | 781 | |
--Owner-Occupied | 129 | 407 | 496 | |
--Renter-Occupied | 48 | 146 | 167 | |
Owner-Occupied Values | < 100K | 55 | 169 | 193 |
100-199K | 59 | 181 | 208 | |
200-299K | 9 | 31 | 47 | |
300-399K | 5 | 17 | 26 | |
400-499K | 2 | 6 | 10 | |
500K+ | 0 | 2 | 11 | |
Total Working Age Population | 327 | 1,032 | 1,264 | |
In Work Force | 218 | 689 | 853 | |
Not In Work Force | 109 | 343 | 411 | |
Workforce Employed | 210 | 664 | 825 | |
Workforce Unemployed | 8 | 25 | 28 | |
Civlian Workforce | 218 | 689 | 853 | |
Military Workforce | 0 | 0 | 0 | |
Total Households | 177 | 552 | 664 | |
Family Households | 121 | 379 | 463 | |
Non-Family Households | 57 | 173 | 201 | |
Married Couple | 106 | 333 | 408 | |
Other Family | 15 | 46 | 55 | |
Married w/Child | 39 | 121 | 145 | |
Single Male w/Child | 7 | 20 | 24 | |
Single Female w/Child | 6 | 18 | 19 |
Population Change Last Two Decades - Plus Projection
2000 | % | 2010 | % | 2020 | % | 2030 | |
---|---|---|---|---|---|---|---|
South Dakota | 754,844 | +8 | 814,180 | +9 | 889,447 | +7 | 951,885 |
McCook County | 5,832 | -4 | 5,618 | 0 | 5,639 | +3 | 5,816 |
Total Working Age Population:
Total Households:
Total Working Age Population:
Total Households:
Total Working Age Population:
Total Households: