Office Space
2519 West 8th Street Sioux Falls, SD 57104
2519 West 8th Street Sioux Falls, SD 57104

Details & Description
Property Highlights
- • Year built: 1987
- • Paved parking lot with 27 spaces
- • Zoning: RE3
- • Current long-term tenant (Counseling)
- • Recent 5-year extension, no further options
- • Well-maintained property
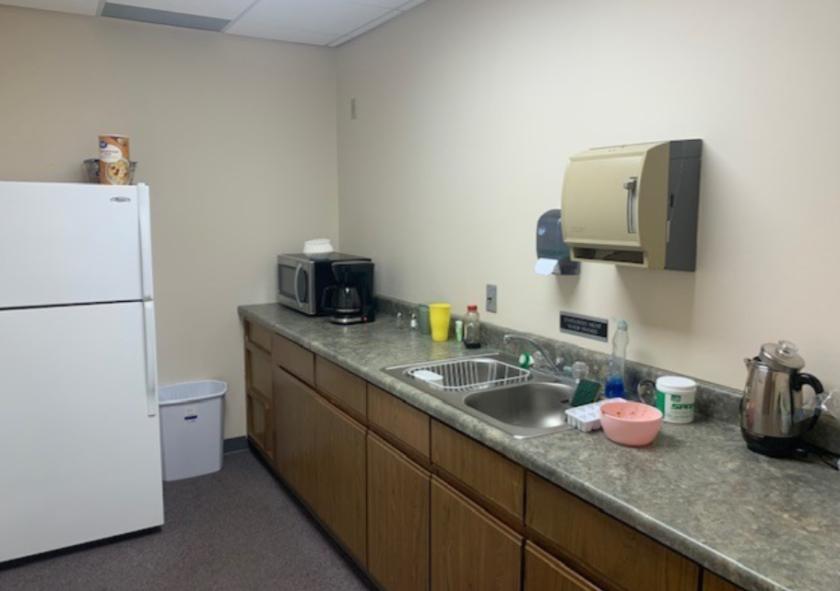
Additional Photos


Listing Agents

Ryan Ammann
O: 605-357-7100
M: 605-310-7091
rammann@naisiouxfalls.com
O: 605-357-7100
M: 605-310-7091
rammann@naisiouxfalls.com
While we strive to provide the most accurate information, all listing information, and demographic data, is provided by third-parties. As such, MyEListing will not be responsible for the accuracy of the information. It is strongly recommended that you verify all information with the listing agent, and any relevant agencies, prior to making any decisions.


