Commercial Land
109 - 201 New Hope Rd and 113 - 209 Industrial Ct Crooks, SD 57020
109 - 201 New Hope Rd and 113 - 209 Industrial Ct Crooks, SD 57020

Details & Description
Property Highlights
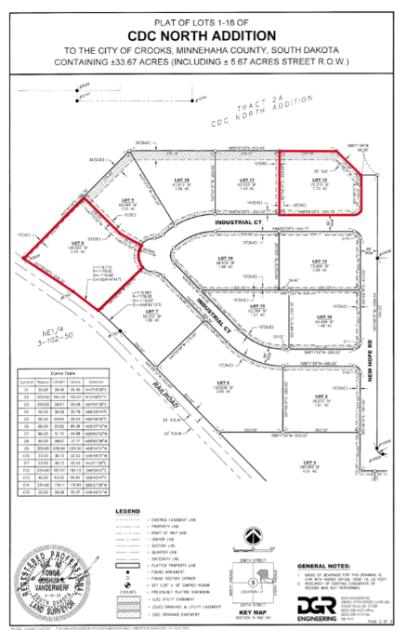
- • Number Of Lots 4
- • Build-ready lots
- • City water and sewer
- • Natural gas
- • Completed streets
- • Rail access on lots 4 & 8
Additional Photos


Listing Agents

Troy Fawcett
O: 605-357-7100
M: 605-321-2199
tfawcett@naisiouxfalls.com
O: 605-357-7100
M: 605-321-2199
tfawcett@naisiouxfalls.com

Bill Connelly
O: 605-444-7130
M: 605-254-2360
bconnelly@naisiouxfalls.com
O: 605-444-7130
M: 605-254-2360
bconnelly@naisiouxfalls.com
While we strive to provide the most accurate information, all listing information, and demographic data, is provided by third-parties. As such, MyEListing will not be responsible for the accuracy of the information. It is strongly recommended that you verify all information with the listing agent, and any relevant agencies, prior to making any decisions.


