Retail Space
380 West Washington Street Bath, NY 14810
380 West Washington Street Bath, NY 14810

Details & Description
Property Highlights
- • Signalized Intersection
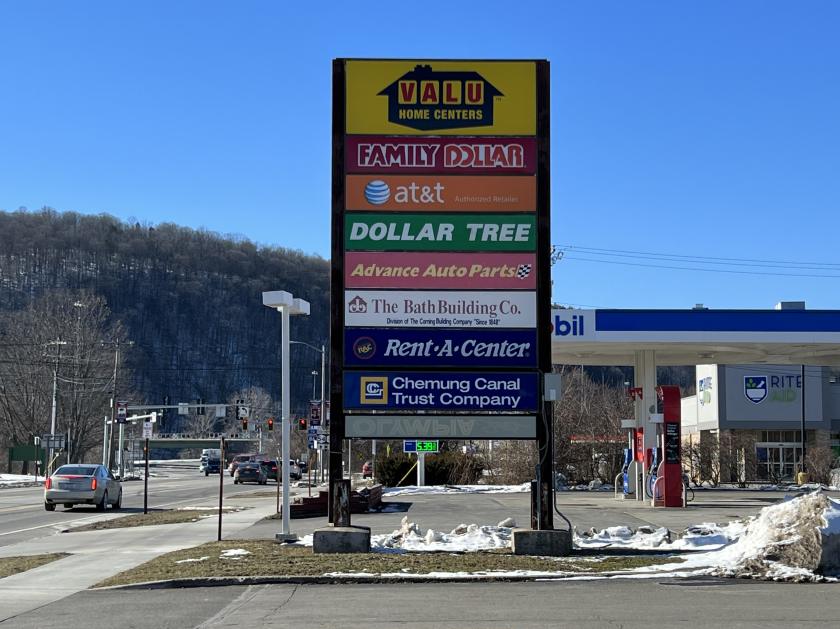
- • Pylon Signage
- • Ample Parking
- • Flexible Lease Terms
Additional Photos


Listing Agents

Michael Conroy
O: 585-735-7739
M: 585-802-3327
michael.conroy@expcommercial.com
O: 585-735-7739
M: 585-802-3327
michael.conroy@expcommercial.com
While we strive to provide the most accurate information, all listing information, and demographic data, is provided by third-parties. As such, MyEListing will not be responsible for the accuracy of the information. It is strongly recommended that you verify all information with the listing agent, and any relevant agencies, prior to making any decisions.


