Commercial Land
300 Kenneth Drive Rochester, NY 14623
300 Kenneth Drive Rochester, NY 14623
Details & Description
Property Highlights
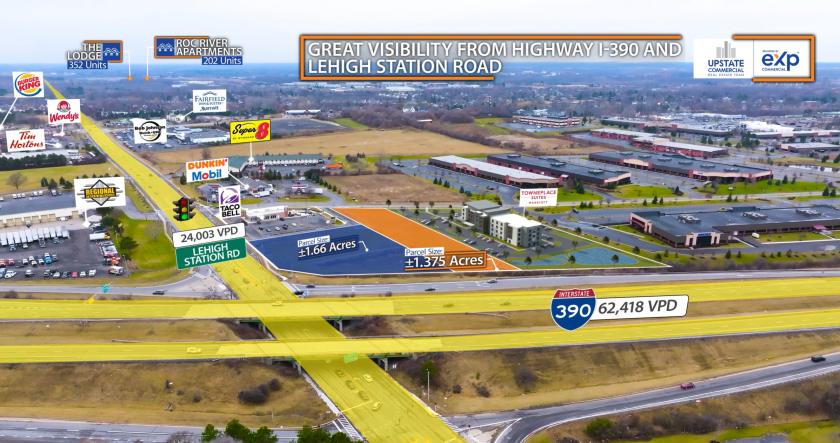
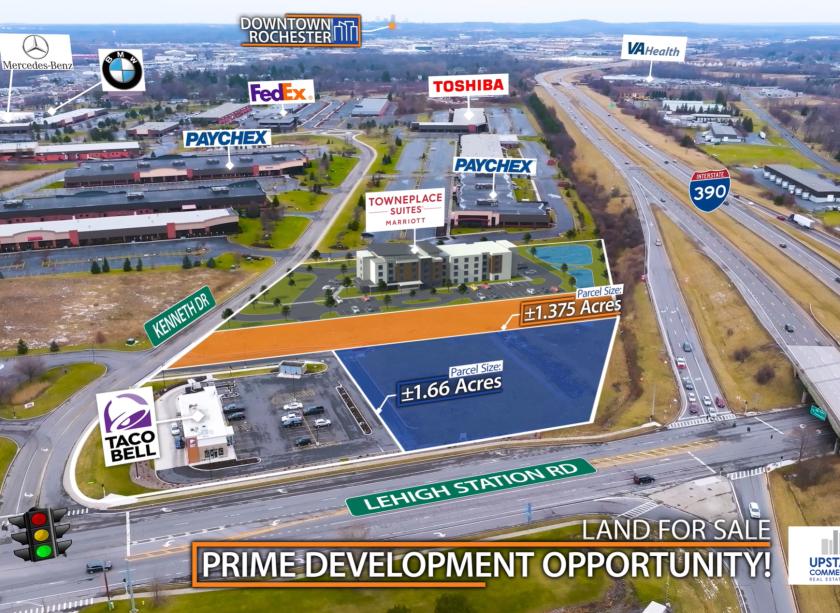
- • Less Than 1 Mile From NYS Thruway (Rt I90)
- • Immediately Adjacent to Highway I-390
- • Traffic Light Access
- • High Traffic Counts
Listing Agents

Michael Conroy
O: 585-735-7739
M: 585-802-3327
michael.conroy@expcommercial.com
O: 585-735-7739
M: 585-802-3327
michael.conroy@expcommercial.com
While we strive to provide the most accurate information, all listing information, and demographic data, is provided by third-parties. As such, MyEListing will not be responsible for the accuracy of the information. It is strongly recommended that you verify all information with the listing agent, and any relevant agencies, prior to making any decisions.