Commercial Land
283 North Main Street Warsaw, NY 14569
283 North Main Street Warsaw, NY 14569

Details & Description
Property Highlights
- • Shovel ready
- • Utilities on-site
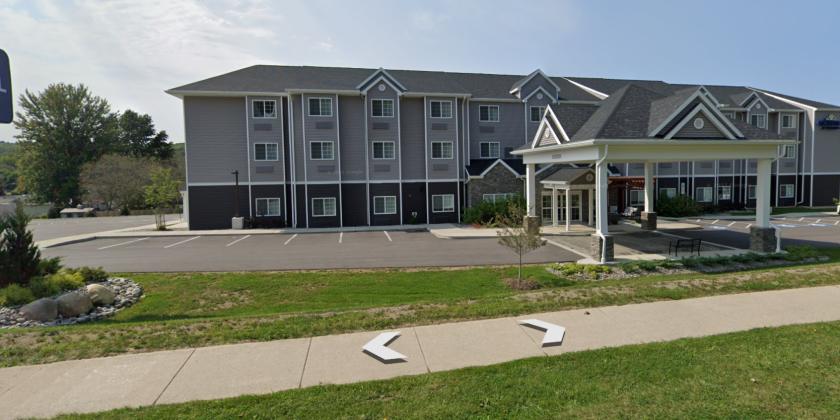
- • Adjacent to Microtel Hotel
Listing Agents

Michael Conroy
O: 585-735-7739
M: 585-802-3327
michael.conroy@expcommercial.com
O: 585-735-7739
M: 585-802-3327
michael.conroy@expcommercial.com
While we strive to provide the most accurate information, all listing information, and demographic data, is provided by third-parties. As such, MyEListing will not be responsible for the accuracy of the information. It is strongly recommended that you verify all information with the listing agent, and any relevant agencies, prior to making any decisions.