Office Space
277 Georgia 74 Peachtree City, GA 30269
277 Georgia 74 Peachtree City, GA 30269

Details & Description
Property Highlights
- • Desirable Peachtree City location
- • Elevator Access
- • Golf Cart Accessible
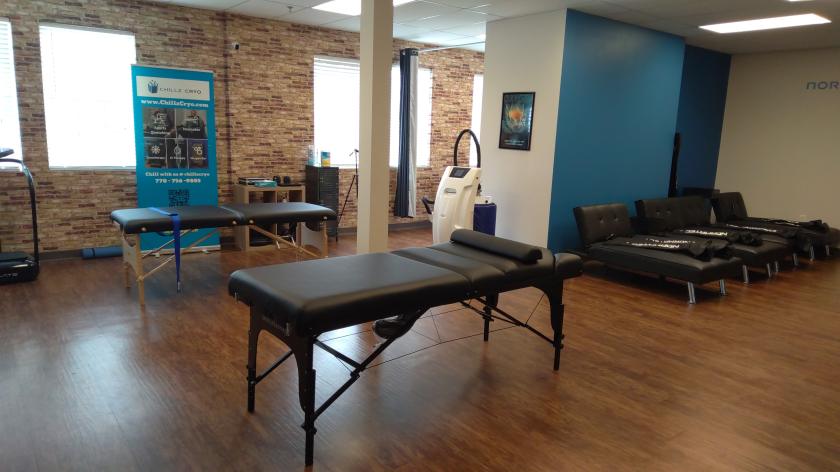
Additional Photos


Listing Agents

Brent Randolph
O: 770-318-6815
brandolph@rwcre.net
O: 770-318-6815
brandolph@rwcre.net

John Payton
O: 770-253-3078
jpayton@rwcre.net
O: 770-253-3078
jpayton@rwcre.net
While we strive to provide the most accurate information, all listing information, and demographic data, is provided by third-parties. As such, MyEListing will not be responsible for the accuracy of the information. It is strongly recommended that you verify all information with the listing agent, and any relevant agencies, prior to making any decisions.


