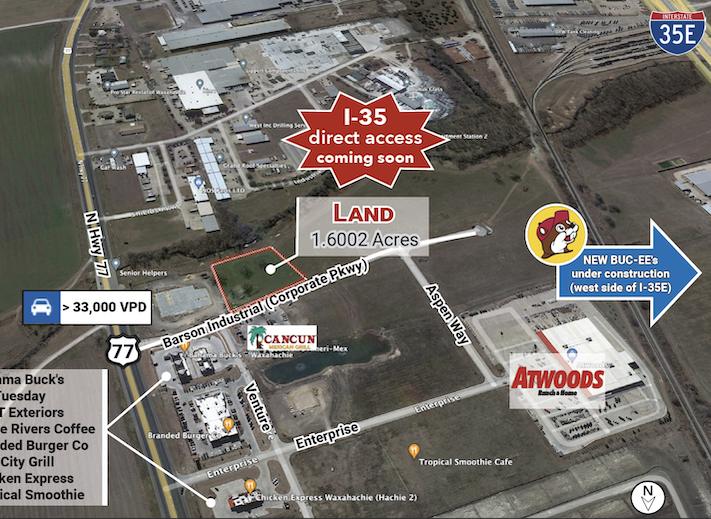
Commercial Land
2022 Shields Pkwy Waxahachie, TX 75165
2022 Shields Pkwy Waxahachie, TX 75165
Details & Description
Property Highlights
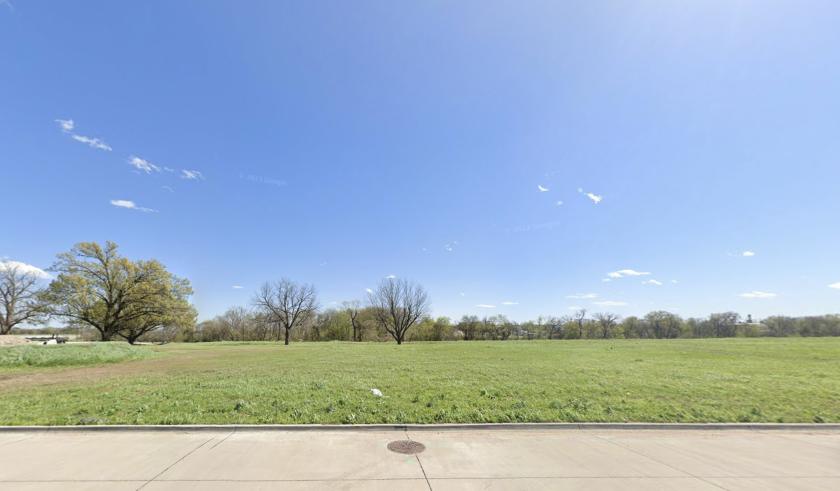
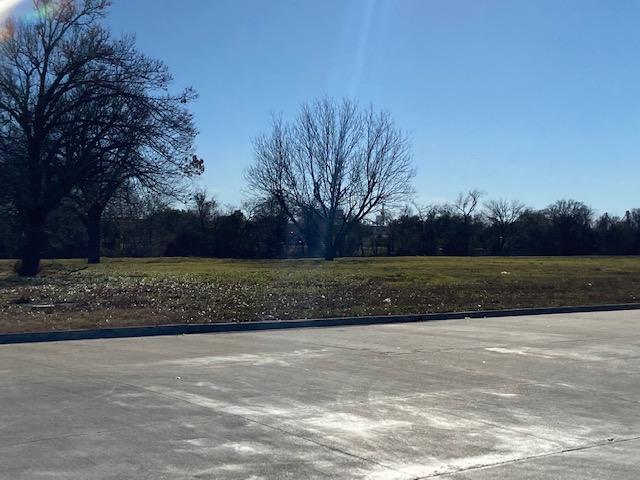
- • Gorgeous Greenbelt Backs Land.
- • Entitled for a full service restaurant.
- • Clean site near new construction and development
Additional Photos

Listing Agents

Justin Owen
O: 214-253-0797
jowen@dominuscommercial.com
O: 214-253-0797
jowen@dominuscommercial.com
While we strive to provide the most accurate information, all listing information, and demographic data, is provided by third-parties. As such, MyEListing will not be responsible for the accuracy of the information. It is strongly recommended that you verify all information with the listing agent, and any relevant agencies, prior to making any decisions.


